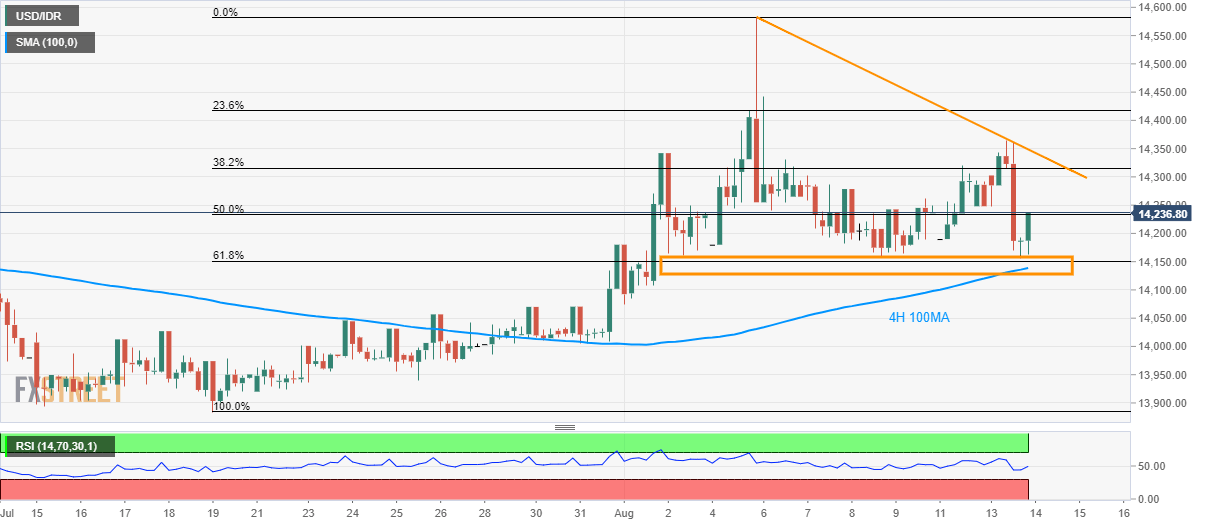
- USD/IDR confronts 50% Fibonacci retracement of latest upside since July 19.
- Pair’s downside capped by 61.8% Fibonacci retracement, 4H 100MA.
USD/IDR registers another bounce off the key 14,139/55 support-zone as it trades near 14,240 during early Wednesday.
The pair now clings to 50% Fibonacci retracement level and can aim for seven-day long resistance-line, at 14,350, in a case of additional rise.
If the quote manages to remain strong beyond 14,350, 23.6% Fibonacci retracement near 14,420 and month’s high close to 14,583 can lure buyers.
On the downside, 61.8% Fibonacci retracement and 100-bar moving average on the four-hour chart (4H 100MA) limits the pair’s near-term declines around 14,139/55.
In a case where sellers manage to conquer 14,139, July 30 high near 14,080, followed by 14,000 round-figure, could be on their radars.
USD/IDR 4-hour chart
Trend: Bullish
