- Ascending trend-channel signals pair’s strength.
- Overbought RSI challenges buyers near the early-January high.
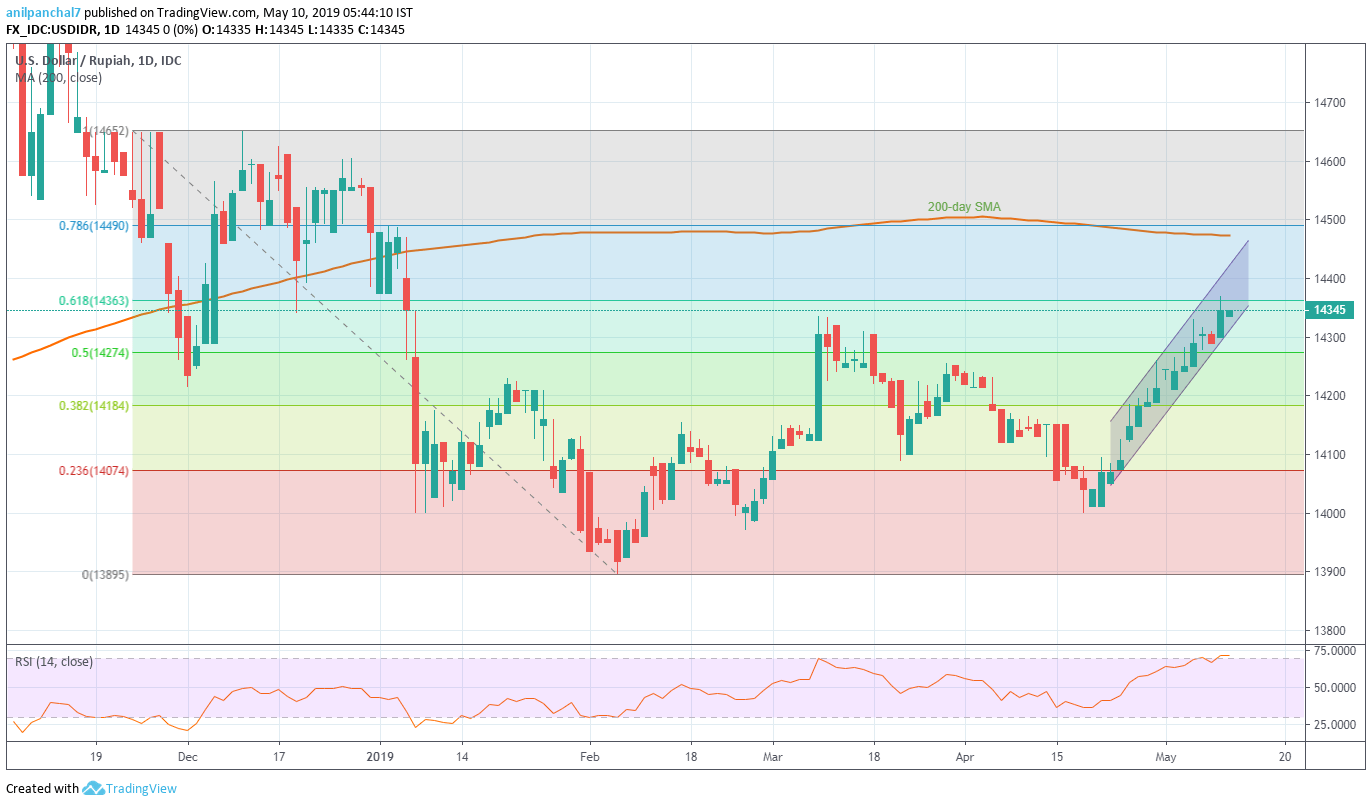
USD/IDR is on the bids near the intra-day high of 14,345 during the Asian session on Friday. While a fortnight old ascending trend-channel portrays the pair’s strength, it still needs to surpass January 07 highs in order to escalate recent upside.
In doing so, channel-resistance at 14,425 can act as nearby important resistance while overbought levels of 14-day relative strength index (RSI) could question further advances.
Should buyers refrain from respecting overbought RSI and cross 14,425 resistance, 200-day simple moving average (SMA) level near 14,475 and year’s top near 14,490 could be on their radar next.
Meanwhile, 14,310 figure comprising channel support could limit the quote’s immediate declines, a break of which highlights 50% Fibonacci retracement level of the pair’s decline from late-November to February at 14,274.
Additionally, pair’s downturn below 14,274 can please sellers with 14,150 and 14,100 rest-points ahead of pushing them towards 14,000 round-figure.
USD/IDR daily chart
Trend: Positive
