- USD/IDR pulls back from near-term key bullish chart patterns.
- 23.6% Fibonacci retracement, July-September lows on sellers’ radar.
- Bulls can target 61.8% Fibonacci retracement during the upside break.
With the multi-month-old descending triangle formation restricting the USD/IDR pair’s immediate moves, the quote drops to 14,090 by the press time of Wednesday’s Asian session.
The quote needs to provide a clear break above the bullish formation resistance, at 14,200, in order to aim for 61.8% Fibonacci retracement of April-June downtick, at 14,344.
Though, pair’s further upside might not refrain from challenging August month top near 14,580 followed by May month highs close to 14,670.
Meanwhile, 23.6% Fibonacci retracement and lows marked since July, close to 13,970 and 13,880 respectively, can keep sellers entertained ahead of diverting them to June month low near 13,750.
USD/IDR daily chart
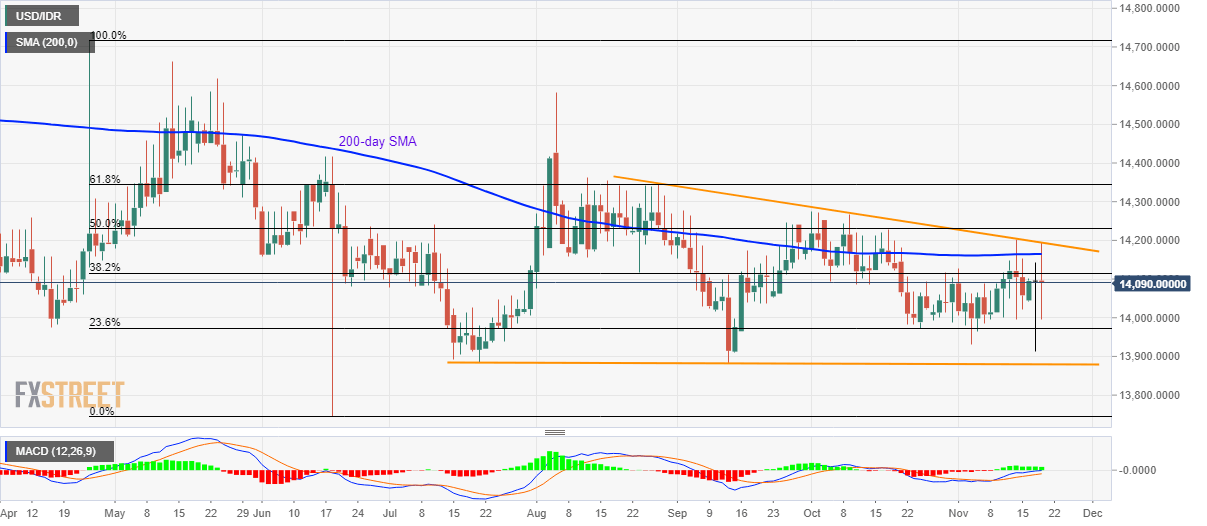
Trend: Sideways
