- USD/IDR benefits from the overall strength of the US dollar.
- Likely inversion of MACD lines indicates further recovery.
- The weekly lows hold the key to pair’s drop below 13,700.
USD/IDR takes the bids to 13,928 by the press time of the pre-European session on Friday. The pair recently surged amid the broad US dollar (USD) strength after investors rushed to risk-safety on US-Iran tensions.
Read: CFR’s Haas: Prepare for all sorts of Iranian retaliation
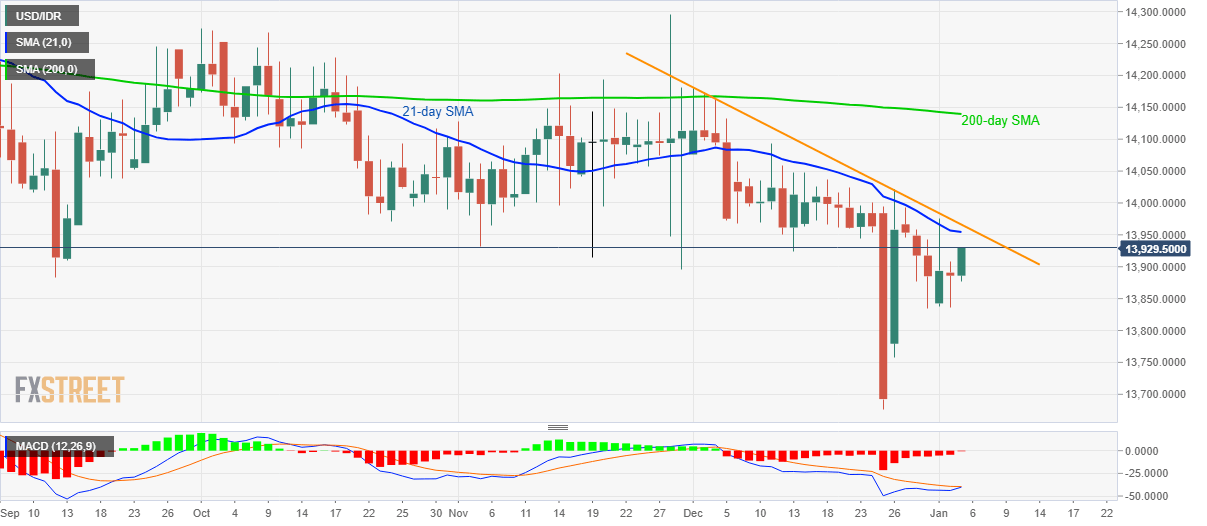
This leads to a bullish MACD formation on the daily chart and an expected confrontation to a 21-day SMA level of 13,955. However, pair’s further advances are likely to be capped by the monthly falling trend line, at 13,965.
If at all prices rally beyond 13,965, December 11 top near 14,100 and 200-day SMA near 14,140 will be on the Bull’s radar.
On the contrary, a daily closing below the weekly low of 13,835 will set the tone for fresh downside targeting sub-13,700 area.
USD/IDR daily chart
Trend: Bearish
