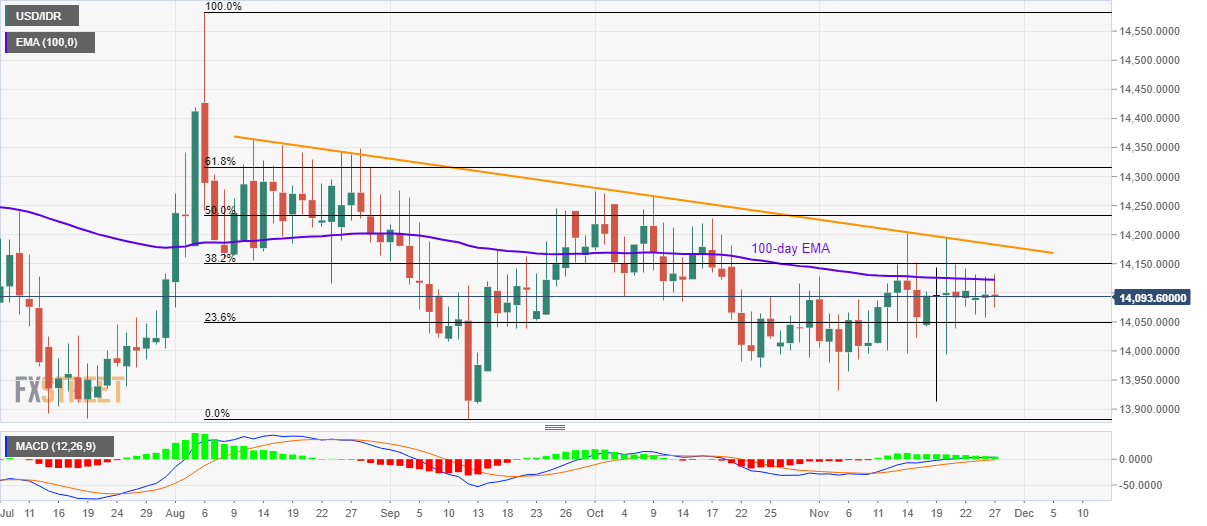
- USD/IDR shows a little movement between 100-day EMA and 23.6% Fibonacci retracement.
- A falling trend line since mid-August adds to the resistance.
- Lows marked in July, September become the key support.
While repeating its seven-week-old formation of trading under 100-day Exponential Moving Average (EMA), USD/IDR takes rounds to 14,095 by the press time of early Wednesday.
Even so, the quote stays above 23.6% Fibonacci retracement level of August-September downpour, at 14,048.
On a broader scale, a downward sloping trend line since August 13 at 14,183 and lows marked in July and September, around 13,880, keep the pair’s moves confined.
It should also be noted that multiple Doji candlestick formations show traders’ indecision while bullish signals from 12-bar Moving Average Convergence and Divergence (MACD) keep buyers hopeful.
USD/IDR daily chart
Trend: Sideways
