- The USD/IDR pair’s short-term moves are restricted by the key technical levels.
- RSI near to descending trend-line break, supporting the odds for an upside.
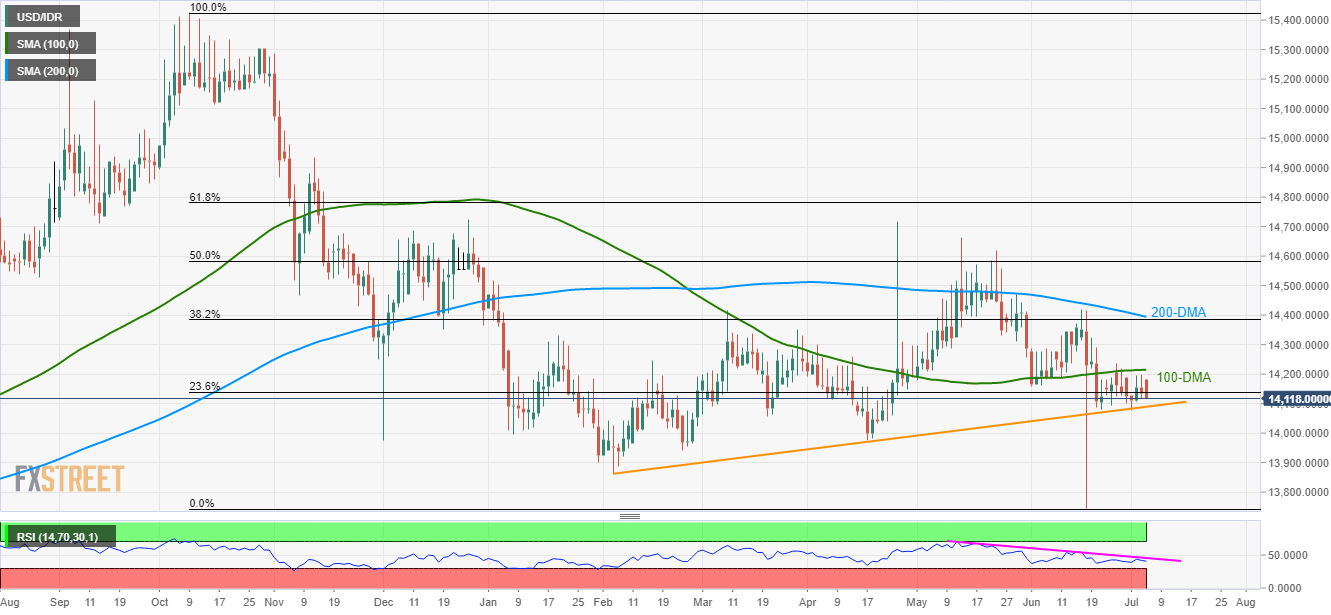
It has been 13-days since the USD/IDR pair trades choppy between the 100-DMA and a five-month ascending trend-line as it takes the rounds to 14,118 during early Thursday.
The aforementioned support-line at 14,089 acts as immediate support, a break of which can magnify the momentum and drive prices down under 14,000 round-figure to April month low at 13,974.
In a case of additional downturn past-13,974, 13,940 and 13,860 could become sellers’ favorites.
Alternatively, the pair’s upside break of 100-day moving average (100-DMA) level of 14,214 can trigger the buying towards 14,280 and 14,350 numbers to the north.
Though, 50% Fibonacci retracement of its late-October to mid-2019 declines and 200-DMA seems the key to limit the pair’s further rise around 14,386/94.
The 14-day relative strength index (RSI) is close to a short-term descending resistance-line, a breakout can increase the odds of upside momentum.
USD/IDR daily chart
Trend: Bullish
