- USD/IDR stays inside the one-week-old symmetrical triangle.
- Sustained trading beyond 4H 200MA portrays the pair’s strength.
USD/IDR continues its week-long trading pattern within a symmetrical triangle while taking rounds to $14,190 during early Wednesday.
Give the pair’s sustained trading beyond 200-bar simple moving average on the four-hour chart (4H 200MA), the upside momentum seems to gain ground and can aim for 14,345/65 region comprising multiple tops since mid-August if managed to rise above 14,262 level comprising resistance-line of the aforementioned triangle.
During the pair’s run-up beyond 14,365, 23.6% Fibonacci retracement of July-August upside, near 14,420, and August month high close to 14,580 will be on the buyers’ radar.
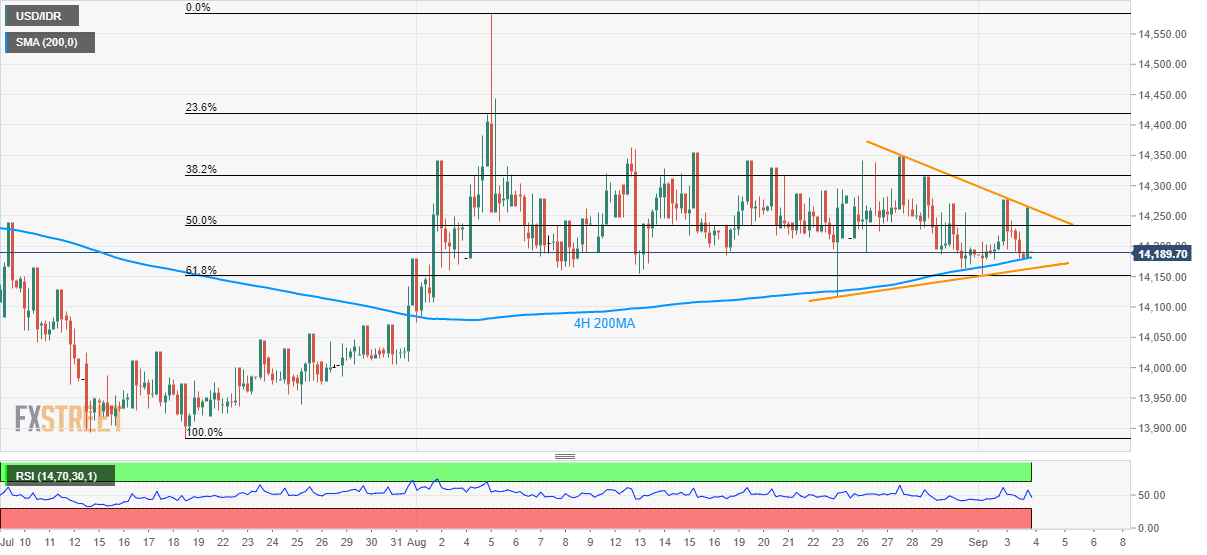
Meanwhile, the pair’s downside break of 4H 200MA level of 14,182 can still get support from the triangle’s lower line, at 14,163, and 61.8% Fibonacci retracement level of 14,152.
In a case prices slip below 14,150 mark, late-July tops surrounding 14,070 and 14,000 round-figure could please sellers.
USD/IDR 4-hour chart
Trend: sideways
