- USD/IDR recovers after registering a bullish candlestick formation.
- 23.6% of Fibonacci retracement can restrict immediate upside.
- July/September lows will be the key to watch during further declines.
USD/IDR takes the bids to 14,019 while extending the previous day’s recovery on early Wednesday.
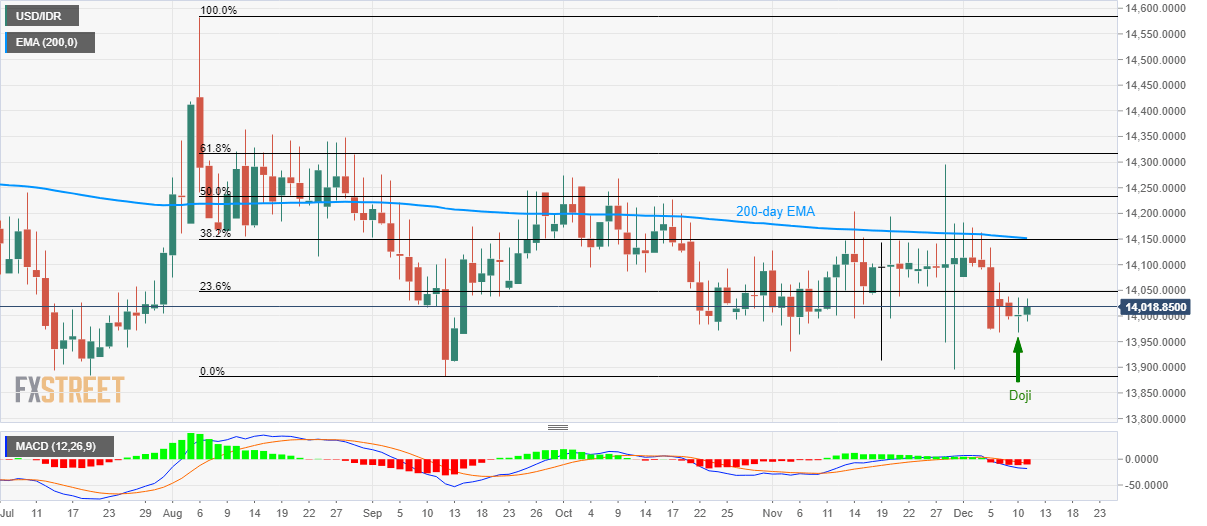
Doji on the daily (D1) chart favors the pair’s further increase with 23.6% Fibonacci retracement of August-September declines, near 14,050, acting as immediate resistance.
It’s worth mentioning that 200-day Exponential Moving Average (EMA) and 38.2% Fibonacci retracement around 14,150/51 will grab major attention, a break of which could propel prices to mid-August levels surrounding 14,350.
Alternatively, pair’s failure to justify the bullish candlestick formation needs to flash a daily close below Tuesday’s low of 13,968 to extend falls to 13,890/80 region comprising lows marked in July and September.
USD/IDR daily chart
Trend: Recovery expected
