- 8-week long descending trend-line, 100-day EMA limit the USD/IDR pair’s immediate upside.
- A downside break of 14,062/59 can fetch prices to a confluence of the April low, 23.6% Fibonacci retracement.
Despite bouncing off late-April lows, the USD/IDR pair couldn’t cross 100-day exponential moving average (EMA) as it takes the rounds to 14,100 during early Thursday.
As a result, chances of the pair’s another decline to 14,062/59 region comprising lows marked on April 24 and July 10 seem brighter.
It should also be noted that extended downturn past-14,059 might not hesitate to drag the quote beneath 14,000 round-figure towards 13,975/75 support-zone that also encompasses 23.6% Fibonacci retracement of April-June downpour and April month low.
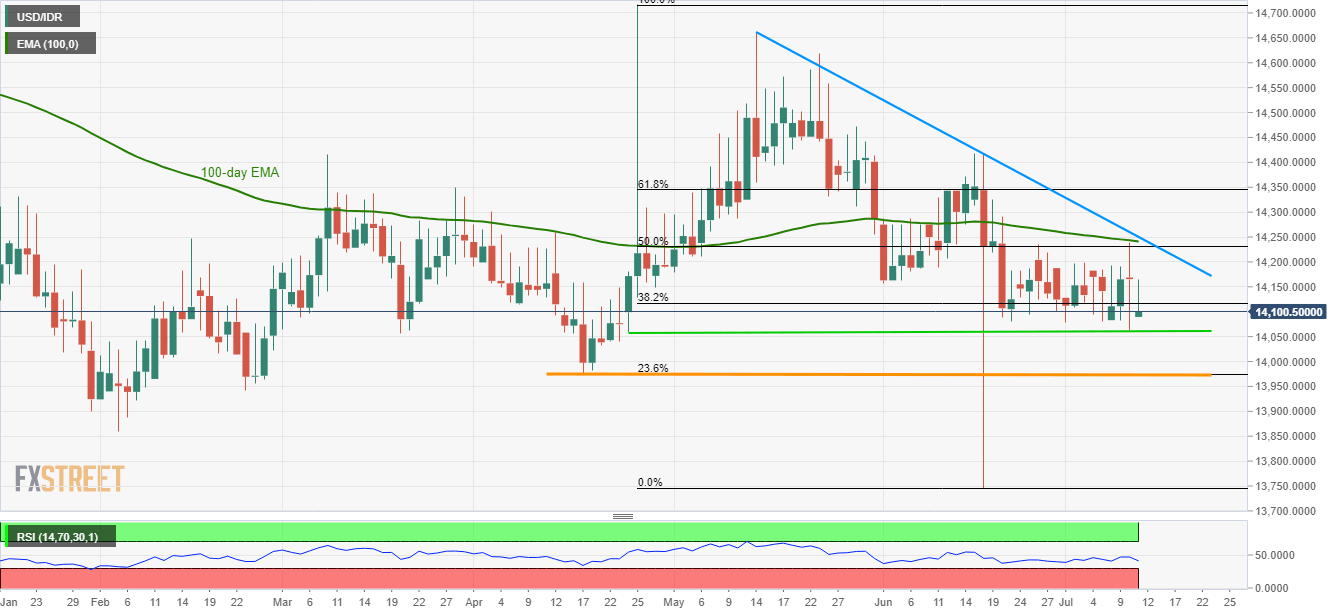
Meanwhile, 100-day EMA level of 14,241 and a downward sloping trend-line since mid-May, at 14,251, can limit the pair’s near-term advances.
In a case where the prices rally past-14,251, 61.8% Fibonacci retracement near 14,346 could gain buyers’ attention.
USDIDR daily chart
Trend: Sideways
