- 4H 50EMA, 50% Fibonacci retracement and a 6-week long descending trend-line caps the USD/IDR pair’s near-term upside.
- 14,080/79 offers key downside support to the pair.
With the 14,140 on its chart, the USD/IDR pair continues to follow a fortnight old trading range by the early Asian morning on Friday.
The 50-bar exponential moving average on the 4-hour chart (4H 50EMA) acts as an immediate resistance at 14,185, followed by 50% Fibonacci retracement of its April-June momentum at 14,232 and a downward sloping trend-line stretched since late-May around 14,275/76.
Should prices manage to rally beyond 14,276, 61.8% Fibonacci retracement near 14,347 and mid-June top close 14,420 can please buyers.
On the downside, 14,080/79 keep limiting the pair’s near-term declines, a break of which should trigger fresh downside to late-April lows surrounding 13,974.
USD/IDR 4-hour chart
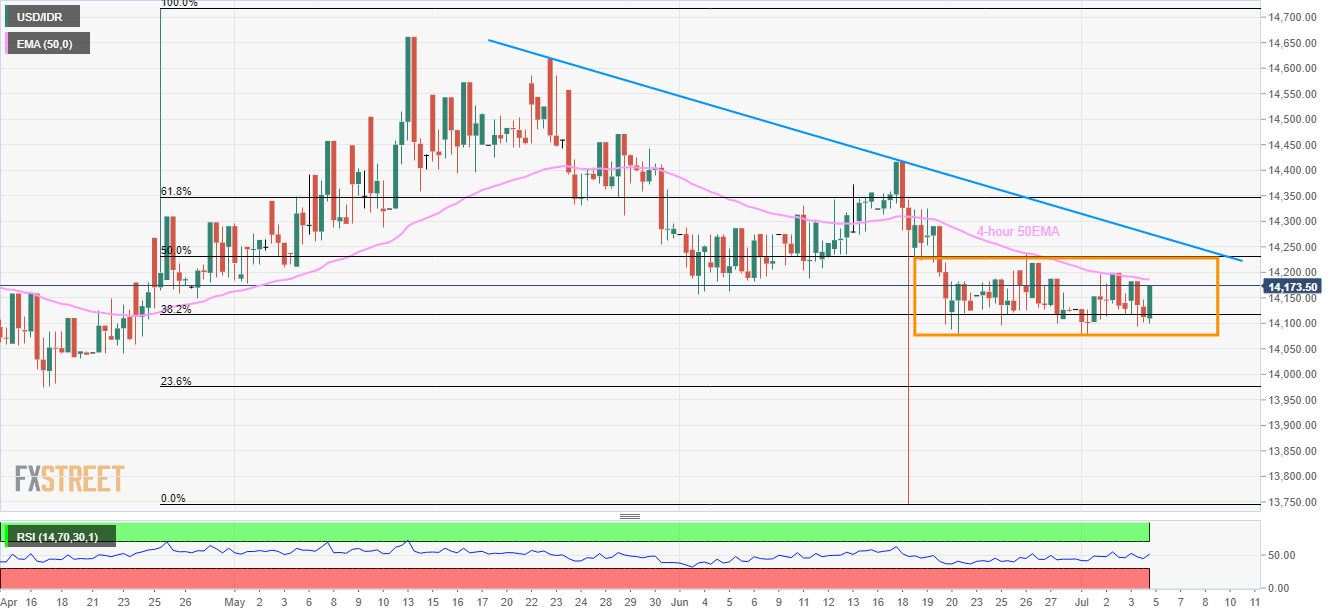
Trend: Sideways
