- USD/IDR seesaws inside the three-week-old falling channel.
- MACD, RSI flash bearish signals as the price slips beneath 50% Fibonacci retracement.
Having slipped below 50% Fibonacci retracement of July-August upside, USD/IDR declines to 14,200 on Friday’s Asian session.
The pair now aims for 61.8% Fibonacci retracement level of 14,151 whereas channel’s support-line at 14,100 will question pair’s further declines.
If prices slip below 14,100, sellers can recall 14,000 and July low near 13,880 on the chart.
Alternatively, 38.2% Fibonacci retracement level of 14,320 and channel’s resistance-line of 14,345 can keep exerting downside pressure on the USD/IDR pair, a break of which will propel it towards August 06 high near 14,450 and then to the monthly top surrounding 14,580.
Adding to note, 12-bar moving average convergence and divergence (MACD) and 14-bar relative strength index (RSI) portrays bearish signals on the chart.
USD/IDR 4-hour chart
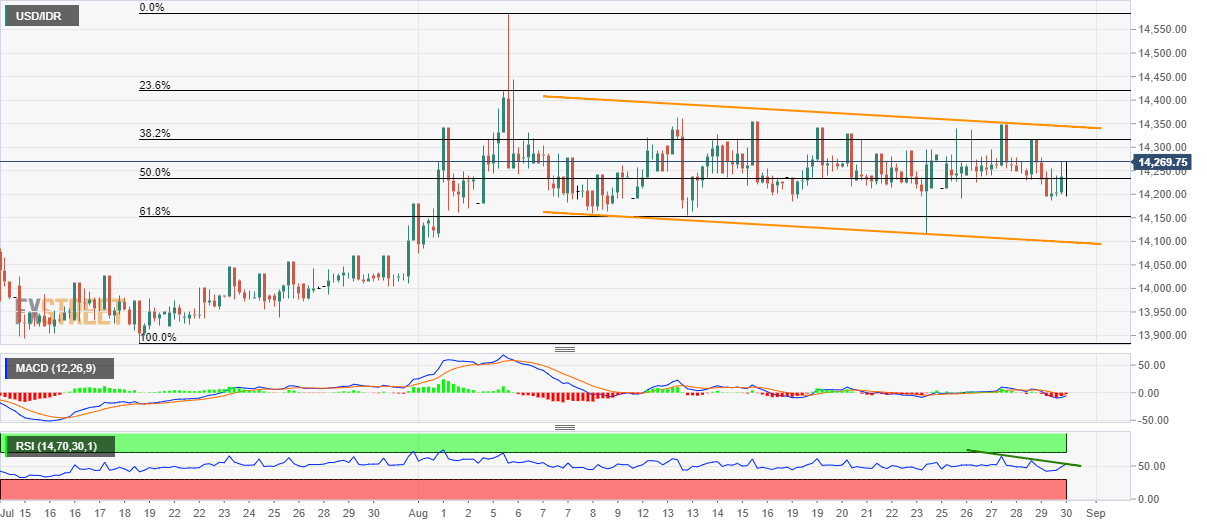
Trend: bearish
