- USD/IDR has multiple key resistances to justify the latest strength that broke 50% Fibonacci retracement.
- Buyers follow the pair’s sustained trading beyond 38.2% Fibonacci retracement, gradually rising RSI.
While sustained trading beyond 38.2% Fibonacci retracement currently propels the USD/IDR pair to flash 14,218 during the early Asian session on Thursday, the pair still has some key resistances to break in order to justify the latest strength.
Among the upside barriers, 100-hour moving average on the 4-hour chart (4H 100MA), becomes the first one to tackle at 14,233, a break of which can escalate the quote’s advances to 61.8% Fibonacci retracement of May-June decline at 14,311 and 200-hour moving average (4H 200MA) level around 14,321.
However, five-week-old descending trend-line near 14,343 may limit the pair’s rise past-14,321 if not then month’s top near 14,416 could lure the buyers.
Alternatively, 38.2% Fibonacci retracement level of 14,095 and a downward sloping trend-line since June 03, at 14,053 holds the gate for the pair’s slump to latest flash crash low around $13750.
USD/IDR 4-Hour chart
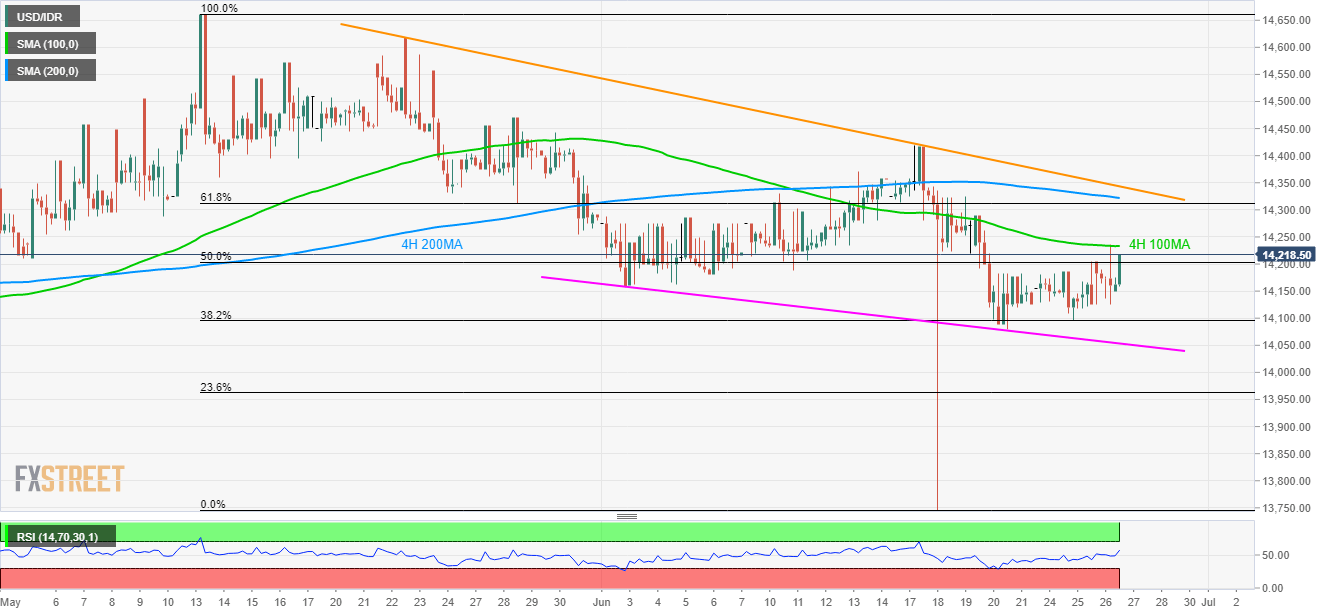
Trend: Pullback expected
