- Multiple horizontal-lines can limit the quote’s immediate downside.
- RSI raises a question for buyers.
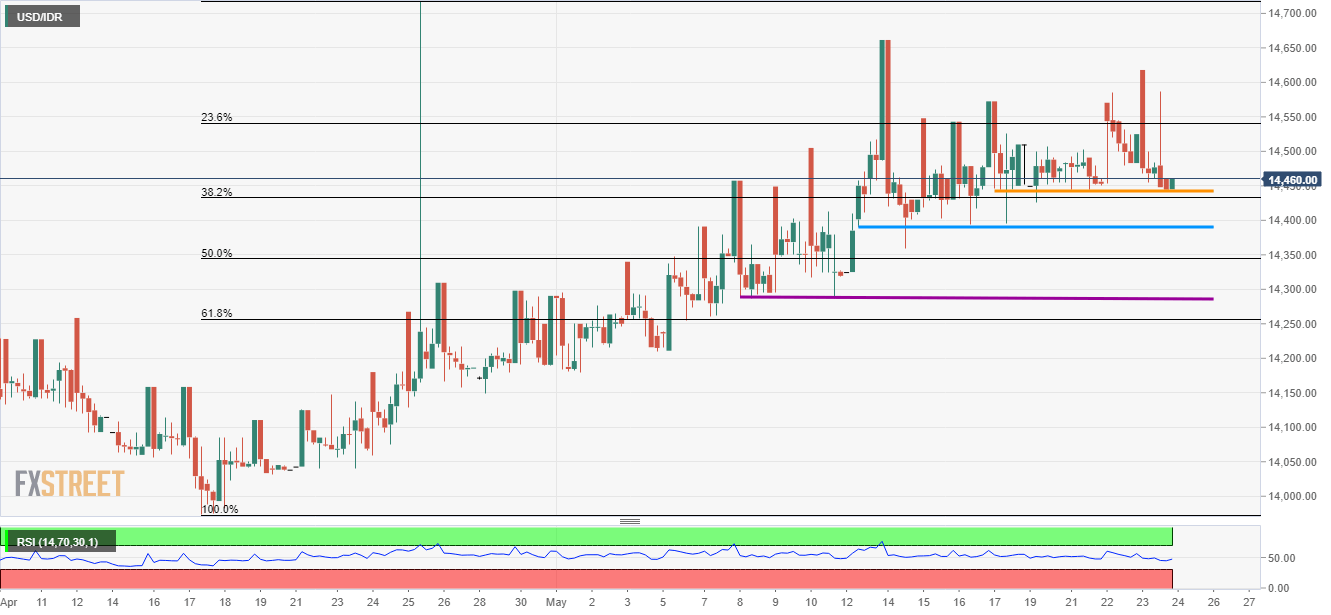
With its another ounce off the horizontal support-line, the USD/IDR pair is on the bids near 14,460 during early Friday.
Latest U-turn from a weeklong support signal brighter chances of the quote’s recovery to 14,500 and 14,590 numbers to the north.
Additionally, pair’s sustained rise beyond 14,590, even if likely being challenged by the relative strength index (RSI), can aim for 14,660 and 14,720 to entertain buyers then after.
On the contrary, declines beneath 14,440 can avail a bit longer horizontal-line, at 14,385, ahead of visiting 50% Fibonacci retracement of April month upside that stands near 14,345.
Should there be further weakness in prices under 14,345, 14,285 and 61.8% Fibonacci retracement near 14,255 may reappear on the chart.
USD/IDR 4-Hour chart
Trend: Pullback expected
