USD/IDR remains on a back foot lobe seven-day old falling trend-line. 50-day EMA, 61.8% Fibonacci retracement gain sellers’ attention. MACD, RSI signal further weakness. 
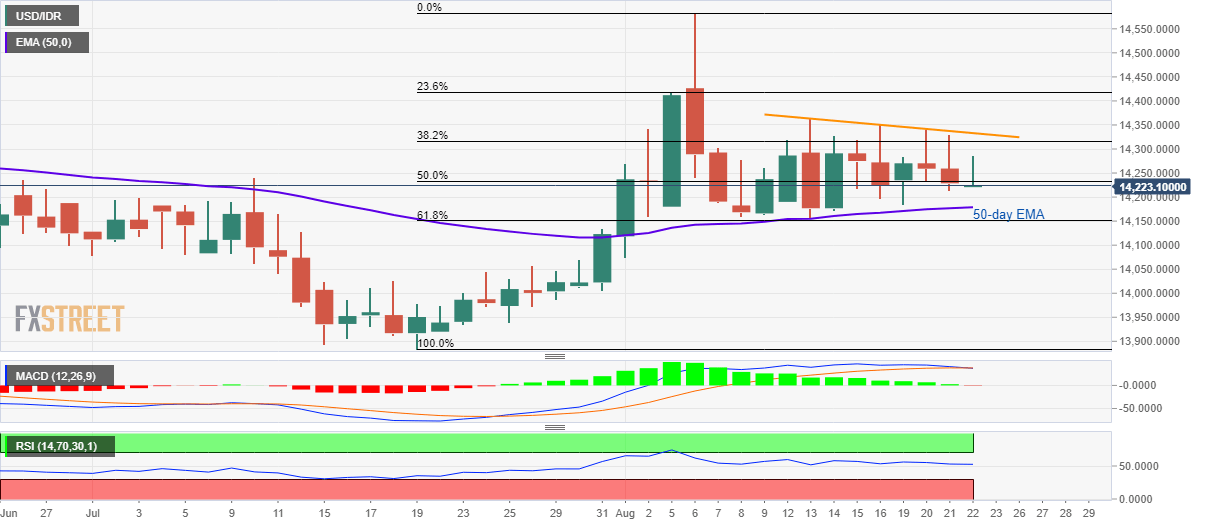
With the key technical indicators limiting the USD/IDR pair’s moves, the quote seesaws near 14,230 during early Thursday. In addition to the downward sloping trend-line since August 13 limiting the pair’s immediate upside, at 14,333, gradually declining 14-bar relative strength index (RSI) and 12-bar moving average convergence and divergence (MACD) also portrays the pair’s weakness. As a result, chances of its declines to 50-day exponential moving average (EMA) level around 14,180 and then a following drop to 61.8% Fibonacci retracement of July-August upside, at 14,150, can well be anticipated. During the pair’s south-run past-14,150, 14,000 and July 19 low near 13,880 gains sellers’ attention. Alternatively, an upside break of 14,333 resistance-line can trigger fresh increase towards 23.6% Fibonacci retracement level close to 14,420 whereas monthly high near 14,580 will lure bulls then after. USD/IDR daily chart Trend: Bearish FX Street FX Street FXStreet is the leading independent portal dedicated to the Foreign Exchange (Forex) market. It was launched in 2000 and the portal has always been proud of their unyielding commitment to provide objective and unbiased information, to enable their users to take better and more confident decisions. View All Post By FX Street FXStreet News share Read Next PBOC sets Yuan reference rate at 7.0490 FX Street 4 years USD/IDR remains on a back foot lobe seven-day old falling trend-line. 50-day EMA, 61.8% Fibonacci retracement gain sellers' attention. MACD, RSI signal further weakness. With the key technical indicators limiting the USD/IDR pair's moves, the quote seesaws near 14,230 during early Thursday. In addition to the downward sloping trend-line since August 13 limiting the pair's immediate upside, at 14,333, gradually declining 14-bar relative strength index (RSI) and 12-bar moving average convergence and divergence (MACD) also portrays the pair's weakness. As a result, chances of its declines to 50-day exponential moving average (EMA) level around 14,180 and then a following drop… Regulated Forex Brokers All Brokers Sponsored Brokers Broker Benefits Min Deposit Score Visit Broker 1 $100T&Cs Apply 0% Commission and No stamp DutyRegulated by US,UK & International StockCopy Successfull Traders 9.8 Visit Site FreeBets Reviews$100Your capital is at risk. 2 T&Cs Apply 9.8 Visit Site FreeBets Reviews$100Your capital is at risk. 3 Recommended Broker $100T&Cs Apply No deposit or withdrawal feesTrade major forex pairs such as EUR/USD with leverage up to 30:1 and tight spreads of 0.9 pips Low $100 minimum deposit to open a trading account 9 Visit Site FreeBets ReviewsYour capital is at risk. 4 T&Cs Apply Visit Site FreeBets ReviewsYour capital is at risk. 5 Recommended Broker $0T&Cs Apply Trade gold, silver, and platinum directly against major currenciesUp to 1:500 leverage for forex trading24/5 customer service by phone and email 9 Visit Site FreeBets ReviewsYour capital is at risk.