- USD/IDR struggles between 61.8% Fibonacci retracement and 50-day EMA.
- A four-week-old rising trend-line adds strength to the support.
With its another U-turn from 61.8% Fibonacci retracement of April-June downpour, USD/IDR aims to revisit 50-day exponential moving average (EMA) while trading near 14,260 amid Friday’s Asian session.
In addition to 50-day EMA, an upward sloping trend-line since July 19 also increases the strength of 14,166/70 support-zone, which if broken could trigger fresh declines to 14,080/75 region including multiple lows marked during late-June and early July.
Alternatively, pair’s daily closing above 14,235 comprising 61.8% Fibonacci retracement can keep prices in check.
Should there be a successful rally beyond 14,235, June high around 14,420 and current month low surrounding 14,583 could lure buyers.
USD/IDR daily chart
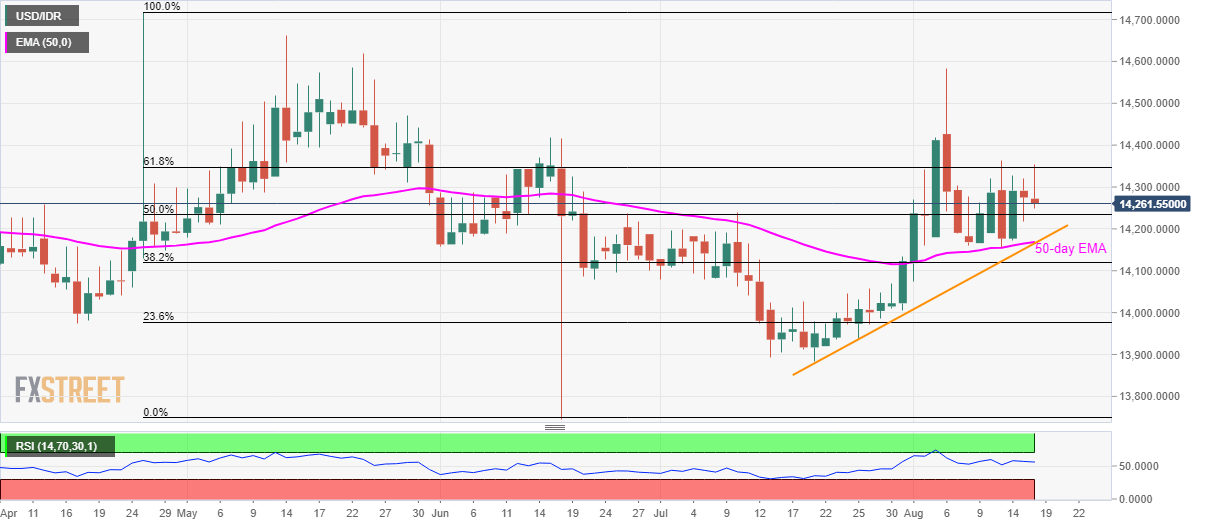
Trend: Sideways
