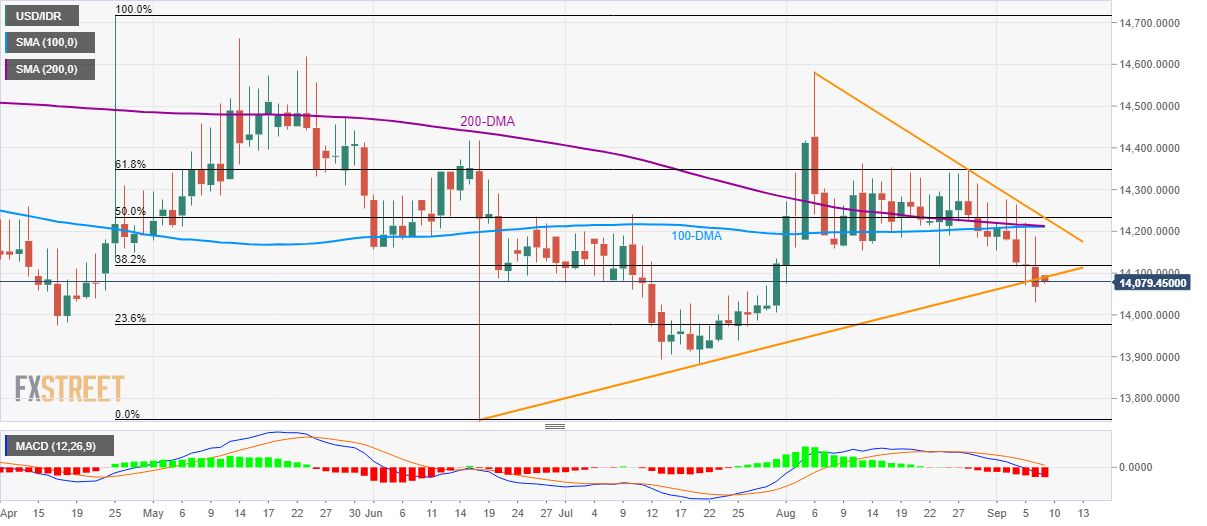
- USD/IDR bounces off to 12-week-old support-line despite breaking it on Friday.
- 100/200-DMA and 14,230/35 confluence limit immediate upside.
- Bearish MACD increases the odds of further declines to 23.6% Fibonacci retracement.
Even after breaking an upward sloping trend-line since mid-June on Friday, the USD/IDR pair refrains from further declines as it trades near 14,095 during the Asian session on Monday.
Sellers await a clear break below 14,090 support-line in order to aim for 23.6% Fibonacci retracement of April-June downpour, at 13,977. However, July month low near 13,880 could restrict the pair’s further declines.
Supporting the odds of pair’s further weakness bearish signal from 12-bar moving average convergence and divergence (MACD) indicator and pair’s sustained trading below 100-day and 200-day simple moving average (DMA).
In a case pair extends the latest pullback beyond 100 and 200-DMA confluence region around 14,210/15, a falling trend-line since early August and 50% Fibonacci retracement could question further advances near 14,230/35.
Given the pair’s ability to surpass 14,235, 61.8% Fibonacci retracement level of 14,347 could flash on buyers’ radar.
USD/IDR technical analysis
Trend: pullback expected
