- USD/INR stays trapped in a sideways market on the third day of the week.
- The level to beat for sellers is the 71.20 support.
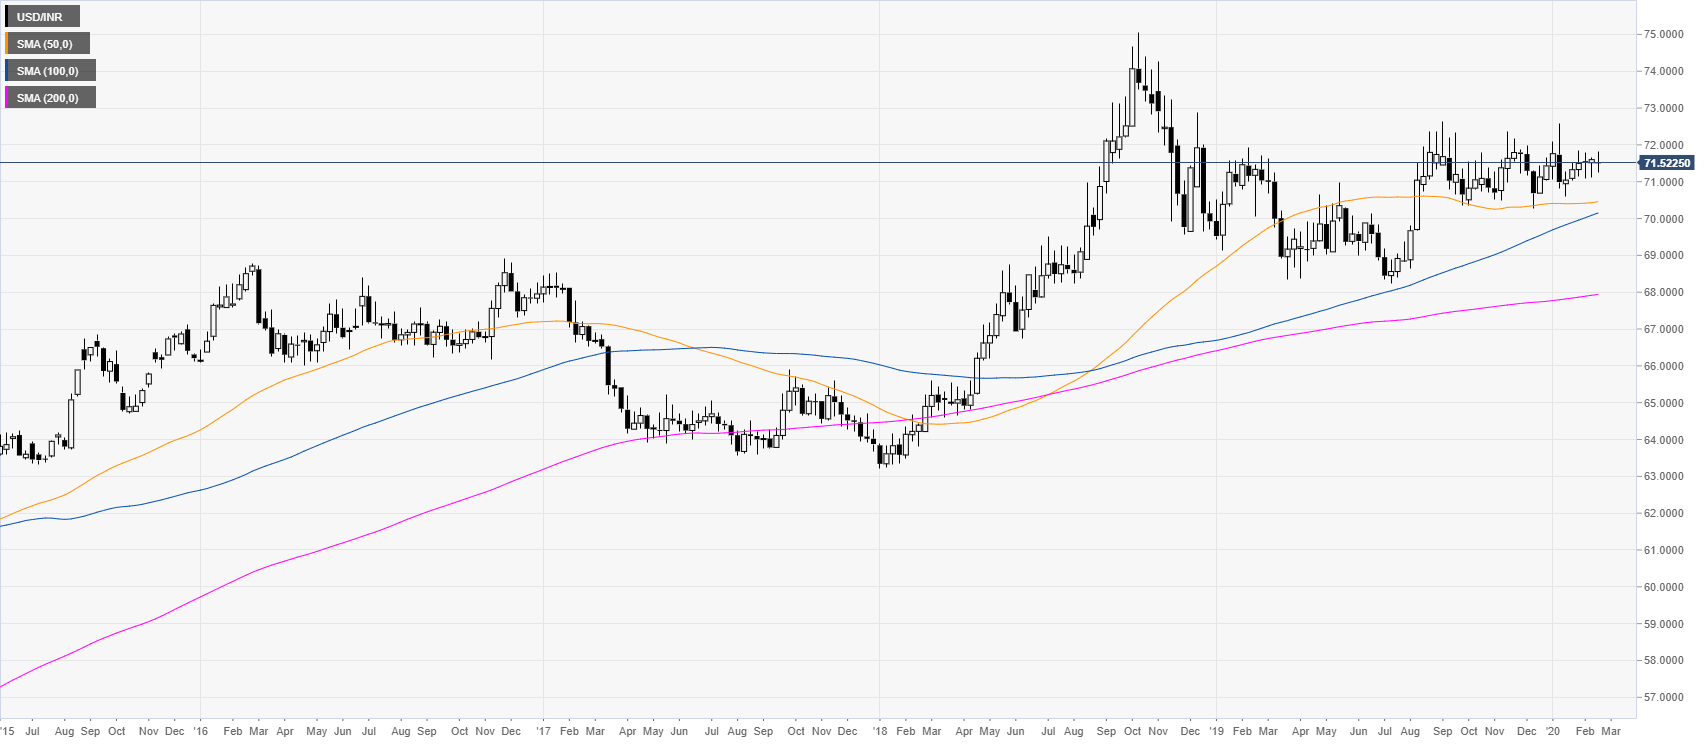
USD/INR weekly chart
After the 2018 bull-market, USD/INR has been consolidating in a rectangle formation. The quote is trading above its main weekly simple moving averages (SMAs), suggesting a bullish momentum in the long term.
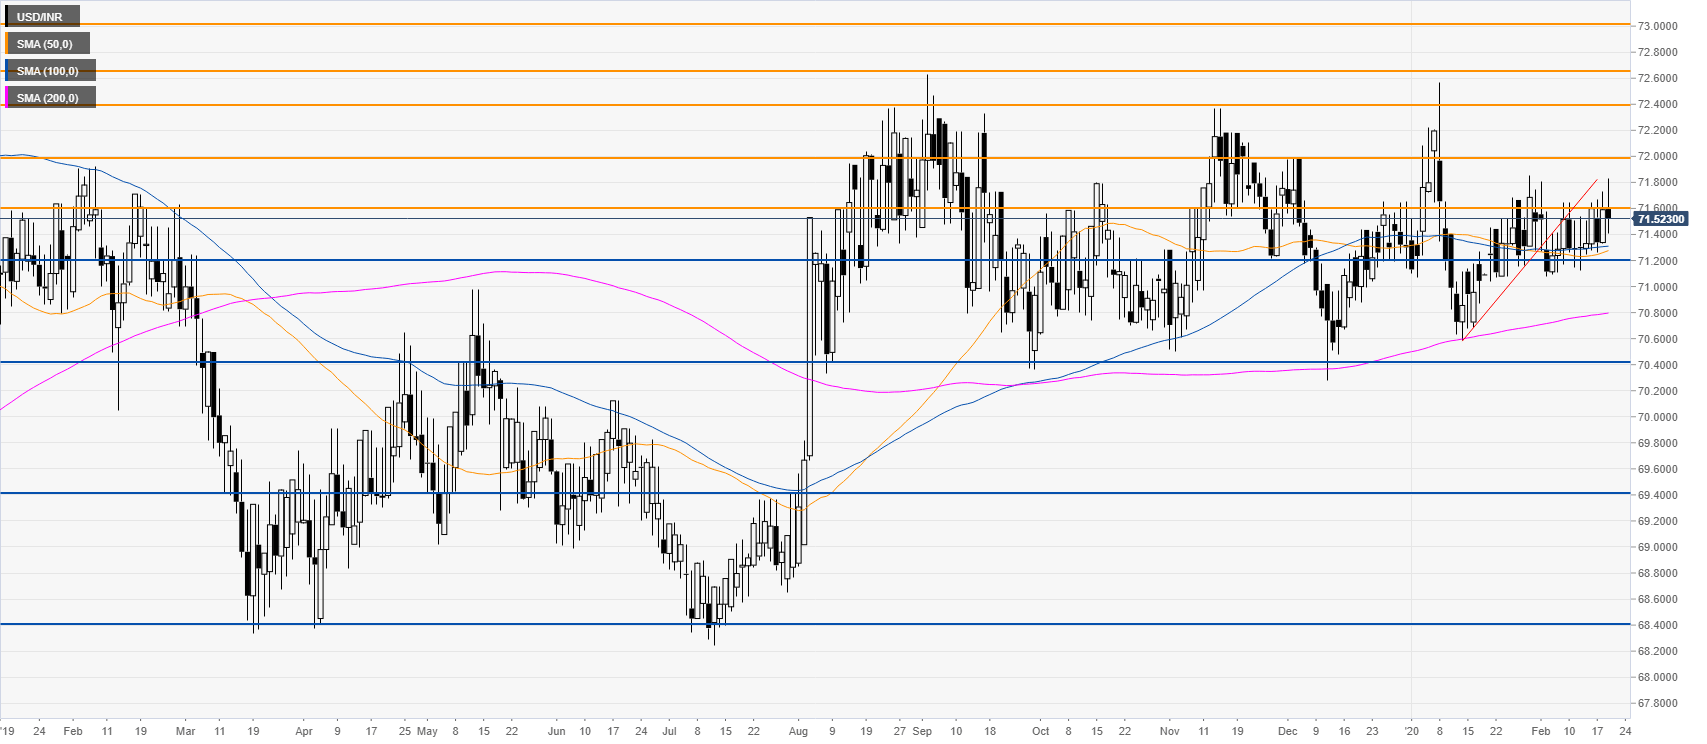
USD/INR daily chart
USD/INR broke below a bear flag formation and bounced from the 71.20 support level to have a retest of 71.60 resistance on many occasions. USD/INR stays trapped in a tight range market while remaining vulnerable below the 71.60/72.00 resistance zone. However, a daily close above the 72.00 psychological level could likely invalidate the bearish scenario and generates further upside towards the 72.40 level.
Additional key levels
