- USD/INR prints mild losses while highlighting a bearish chart pattern on the H1 play.
- Sustained trading below 200-HMA favor sellers, 74.00 can lure the bulls on defying the chart formation.
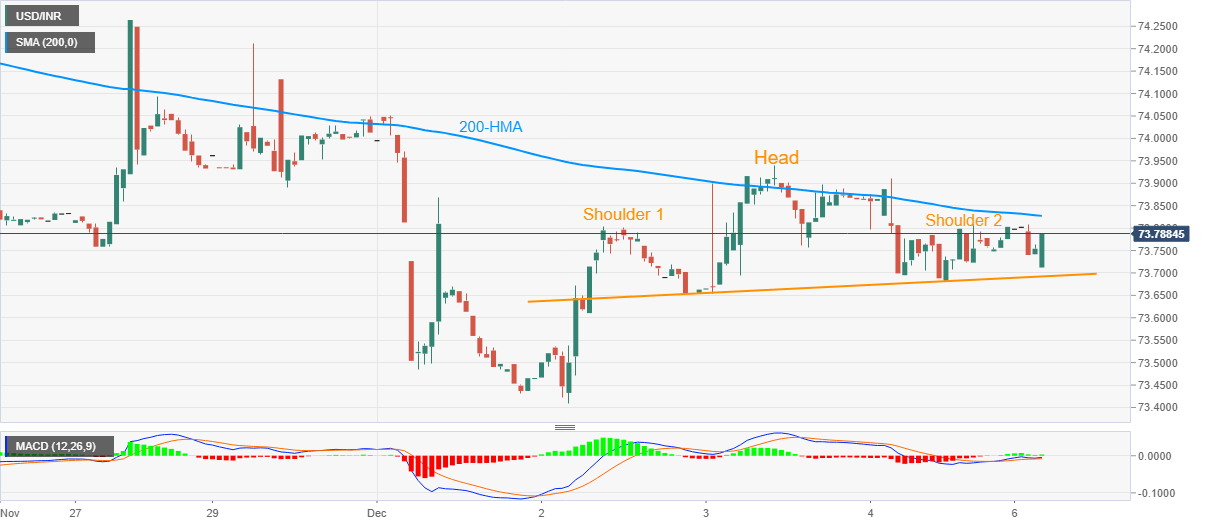
USD/INR remains mildly heavy, despite recently picking up bids around 73.73, during the early Monday’s trading. The pair prints a bearish chart pattern, head and shoulders, on the hourly (1H), play while keeping its momentum below 200-HMA.
As a result, the pair sellers stay hopeful while waiting for a clear downside break of the stated bearish pattern’s neckline, at 73.69 now.
Should the quote successfully breach 73.69, the monthly low around 73.40 and the 73.00 round-figure can lure the USD/INR bears.
Though, lows marked in October and September, respectively around 72.95 and 72.75, can challenge the pair’s downside past-73.00.
Meanwhile, the pair’s upside clearance of 200-HMA, at 73.82 now, can eye for the 74.00 and the monthly peak near 74.05.
Overall, the bearish momentum is paused, for now, but the chart patterns suggest some more downside is likely.
USD/INR hourly chart
Trend: Bearish
