- USD/INR registers a three-day winning streak.
- Normal RSI, higher high favors the bulls.
- Sellers will look for entry below the five-week-old rising support line.
USD/INR gains 0.08% during the early Indian session on Thursday. The quote manages to portray a higher high formation while trading near the highest in six weeks. Also adding strength to the upside momentum is normal conditions of the RSI as well as the sustained rise beyond the key supports.
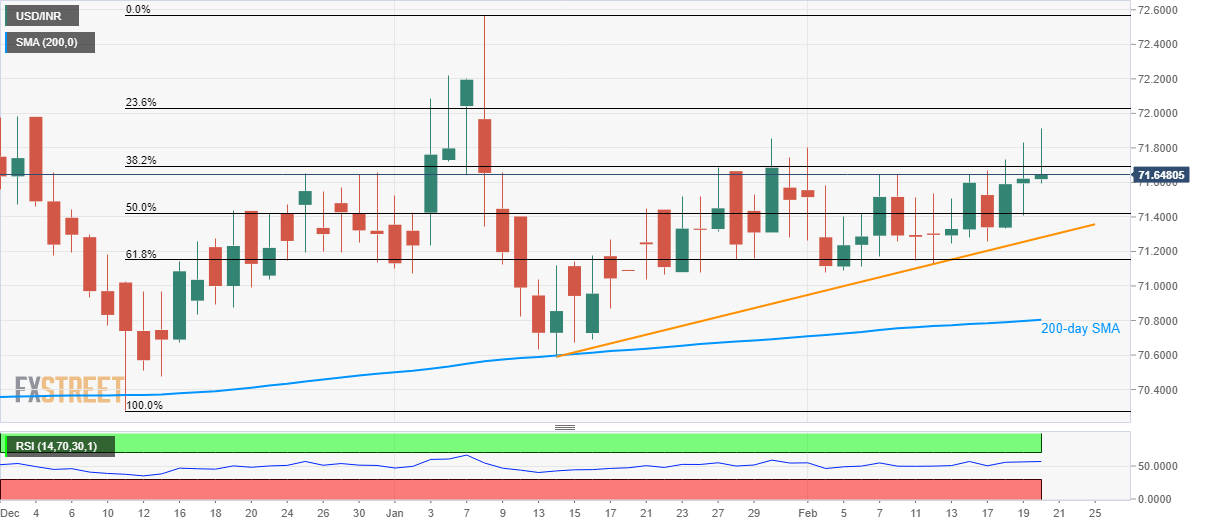
That said, the quote now heads to 23.6% Fibonacci retracement of December 2019 to January 2020 upside, at 72.03 whereas January 05 top near 72.20 can please the bulls afterward.
In a case where the USD/INR prices manage to remain positive past-72.20, the yearly high of 72.60 will be in the spotlight.
Meanwhile, a 50% Fibonacci retracement level of 71.42 can entertain the short-term sellers during the pair’s pullback. However, the quote can’t be termed weak unless breaking a multi-week-old trend line stretched from mid-January, around 71.28 now.
Even if the pair slips below 71.28, 61.8% Fibonacci retracement and 200-day SMA, respectively near 71.15 and 70.80, stand tall to challenge the bears.
USD/INR daily chart
Trend: Bullish
