- USD/INR drops the heaviest in one month after flashing a trend reversal suggesting candlestick the previous day.
- 100-day EMA can offer immediate support amid bullish MACD.
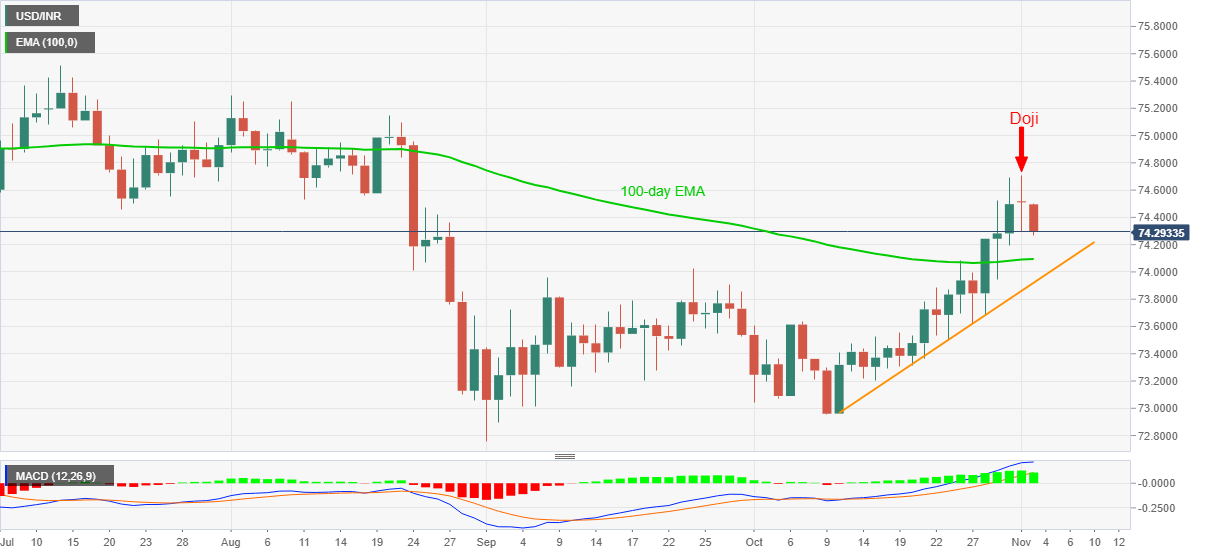
USD/INR drops to 74.30, down 0.28% intraday, while heading into Tuesday’s Asian session. The pair pulled back from a 10-week high on Monday, which in turn portrayed a Doji candlestick on the daily chart near the multi-day top.
While traders seem to respect the bearish candle by press time, 100-day EMA near 74.10, ahead of the 74.00 round-figure, can challenge USD/INR sellers amid bullish MACD.
If at all the quote drops below 74.00 on a daily closing basis, an ascending trend line from October 12, currently around 73.90, will act as an additional downside filter.
Alternatively, a daily close beyond yesterday’s high of 74.70 will negate the bearish signals from the candlestick, which in turn highlights the 75.00 threshold on the USD/INR bulls’ radars.
During the quote’s further upside past-75.00, August month’s peak surrounding 75.30 and July top near 75.50 will be in the spotlight.
USD/INR daily chart
Trend: Further weakness expected
