- USD/INR takes the U-turn from the one-week low.
- 23.6% of Fibonacci retracement acts as immediate resistance.
- Multiple downside barriers to challenge sellers.
USD/INR rises to 71.88, +0.21% during the initial few minutes of the Indian session on Friday. With that, the pair snaps the previous three-day losing streak despite following a bearish candlestick formation on the daily (D1) chart.
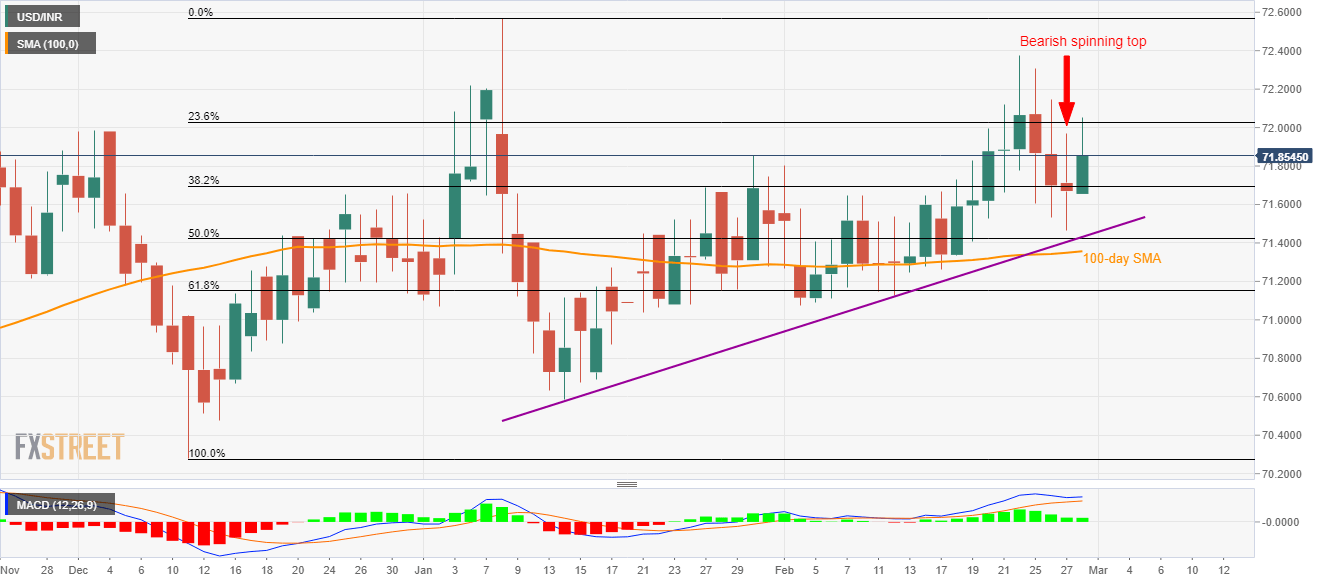
Even so, 23.6% Fibonacci retracement of the pair’s run-up between December 11, 2019, and January 08, 2020, at 72.03, acts as the immediate upside barrier holding the key to the monthly top surrounding 72.38.
During the quote’s further rise past-72.38, 72.57 and 72.63 can offer intermediate halts to the run-up towards 73.00.
Alternatively, 50% Fibonacci retracement and an ascending trend line since early-January 2020, near 71.42/40 can limit the pair’s short-term declines.
Should there be a further weakness below 71.40, 100-day SMA near 71.36 and 61.8% Fibonacci retracement around 71.15 could add supports for the pair.
USD/INR daily chart
Trend: Pullback expected
