- USD/INR’s bounce lacks momentum to pierce key SMA hurdle.
- The weekly chart suggests scope for a deeper drop to a multi-year rising trendline.
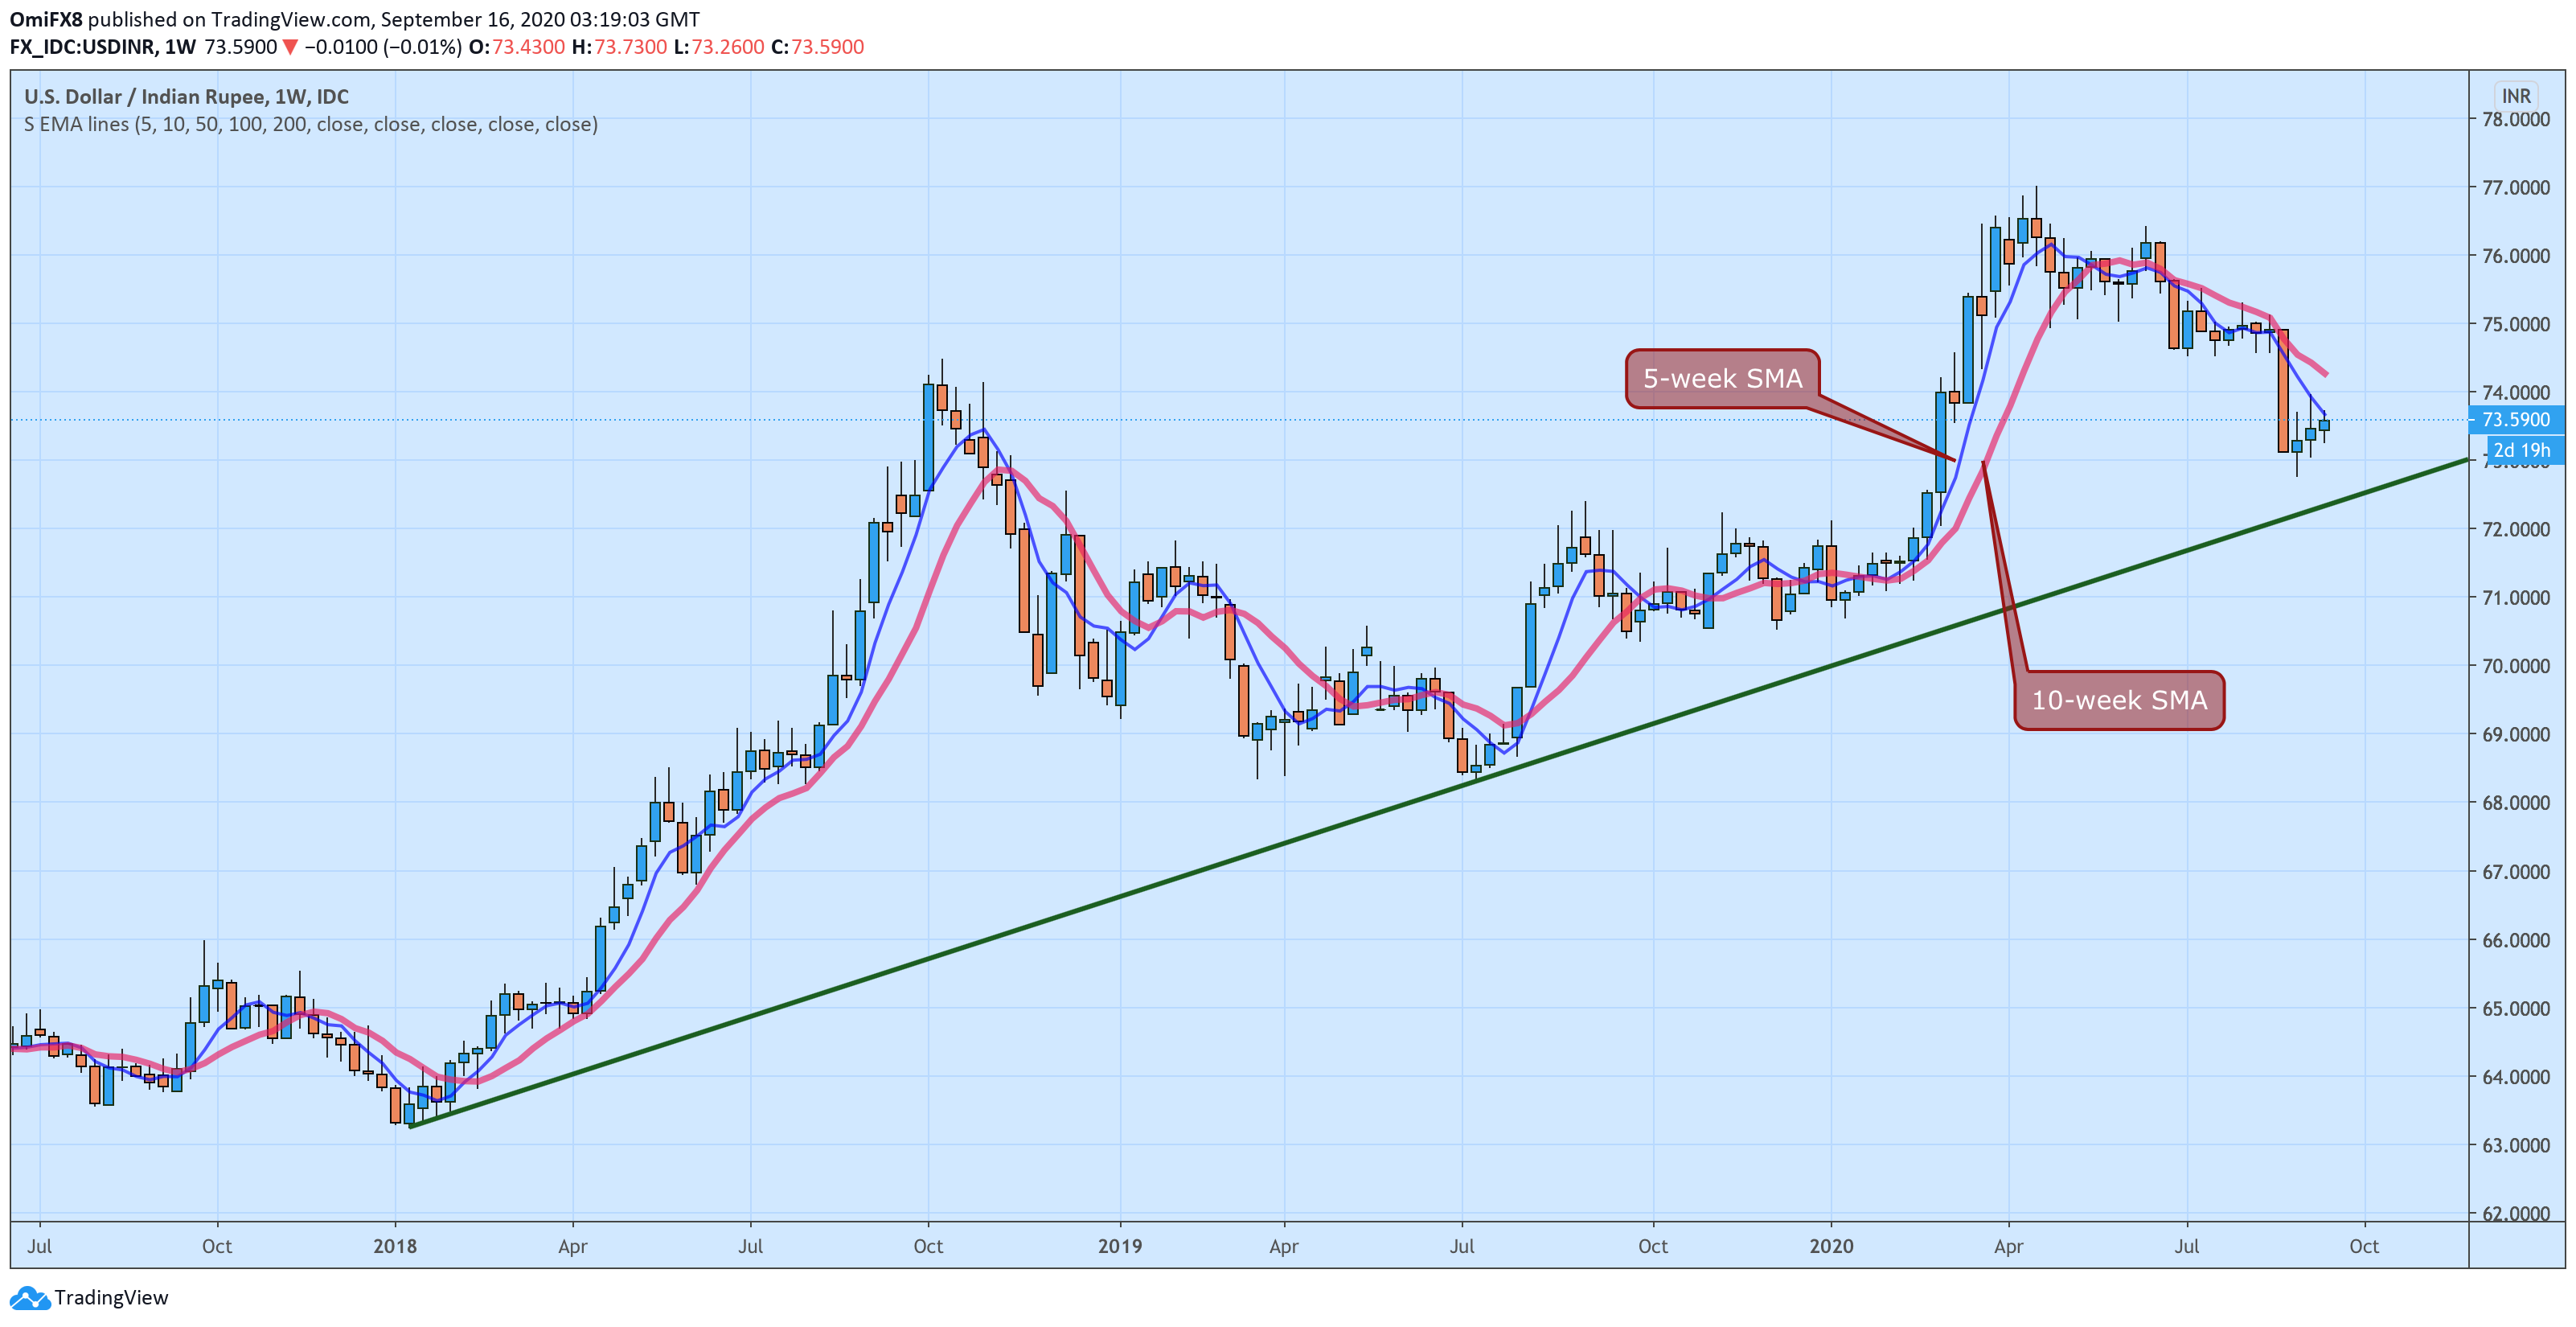
USD/INR is again having a tough time scaling the descending 5-week simple moving average (SMA) hurdle.
The pair jumped by 0.29% on Tuesday but failed to keep gains above the 5-week SMA at 73.677. The average also capped the upside last week.
Another failure to beat the bearish MA line would reinforce the negative outlook put forward by the bearish marubozu candle created in the third week of August and shift risk in favor of a drop to the ascending trendline rising from January 2018 lows.
At press time, the rising trendline support is located at 72.34. The below-50 reading on the 14-week relative strength supports the bearish case.
A convincing move above the descending 10-week SMA, currently at 74.27, is needed to invalidate the negative outlook.
Weekly chart
Trend: Bearish
Technical levels
