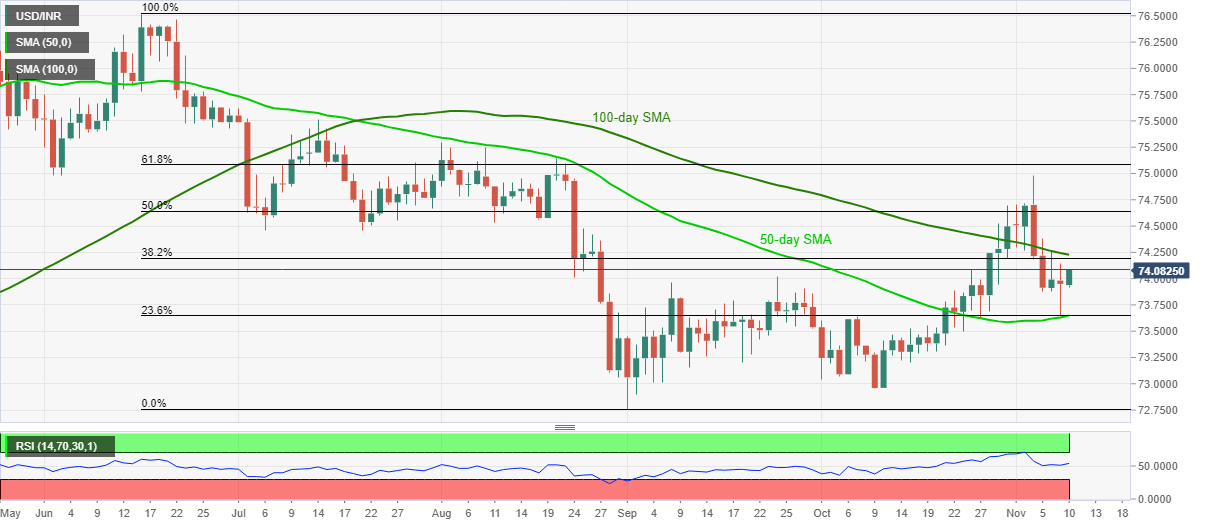
- USD/INR refreshes intraday high while eyeing 100-day SMA resistance.
- Normal RSI conditions favor further consolidation of the pair’s losses.
- Monthly high, 61.8% Fibonacci retracement add to the upside barriers.
USD/INR takes the bids near 74.08, up 0.19% intraday, while heading into Tuesday’s European session. The quote refreshed two-week low the on Monday but failed to slip below 50-day SMA and 23.6% Fibonacci retracement of June-September downside.
Considering the absence of extreme RSI conditions, generally considered above 70 or below 30 levels, USD/INR buyers can attack 100-day SMA, at 74.22 now, during the latest recovery moves.
It should, however, be noted that the bulls are less likely to be convinced of USD/INR north-run should the pair closes past-74.22. The reason could be cited from the existence of key resistance standing tall to challenge any further advances.
Among them, 50% and 61.8% of Fibonacci retracement, respectively around 74.65 and 75.10, will join the monthly peak, surrounding 75.00, to gain the market’s attention.
Meanwhile, a daily closing below the 73.65/60 support confluence, including 50-day SMA and 23.6% of Fibonacci retracement, can witness multiple rest-points around 73.50 before directing the USD/INR sellers towards October’s low of 72.95.
USD/INR daily chart
Trend: Further recovery expected
