- USD/INR drops to the fresh low since November 10 ahead of Indian market’s open.
- Downbeat RSI conditions, one-week-old falling trend line favor sellers.
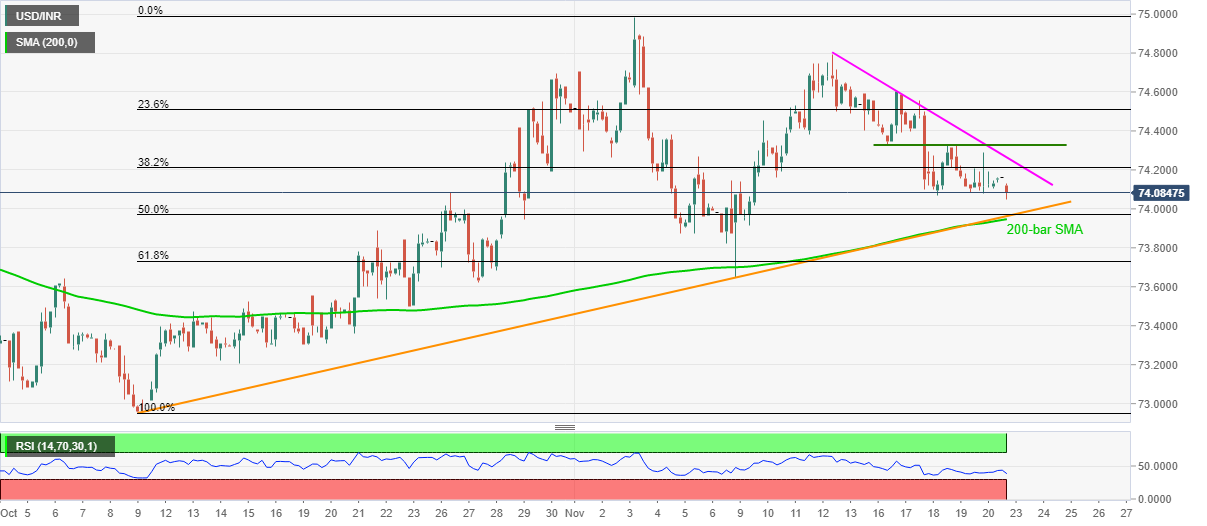
- A confluence of 200-bar SMA, ascending trend line from October 09 and 50% Fibonacci retracement challenge the bears.
USD/INR stays mildly offered around 74.05, down 0.13% intraday, before the Indian markets open for Monday’s trading. In doing so, the pair trades near the early November lows while eyeing the confluence of key technical indicators amid receding RSI conditions.
It should additionally be noted that the 74.00 theshold can offer a filter to the downside targeting the 73.98/95 support joint including 200-bar SMA, a six-week-old rising trend line and 50% Fibonacci retracement of October-November upside.
If at all the USD/INR sellers keep the reins past-73.95, the monthly bottom around 73.65 will be on their radars.
Meanwhile, buyers are less likely to look for entries unless the quote crosses a falling trend line from November 13, at 74.26 now, a break of which will aim for one-week-long horizontal resistance near 74.32.
In a case where the USD/INR buyers dominate past-74.32, 74.80 and the monthly top near 74.98/99 will be in the spotlight.
USD/INR four-hour chart
Trend: Bearish
