- USD/INR fails to respect bearish candlestick as it recovers from 74.79.
- 21-day SMA exerts immediate downside pressure around monthly falling trendline.
- 74.45 becomes the key support to watch for the bears.
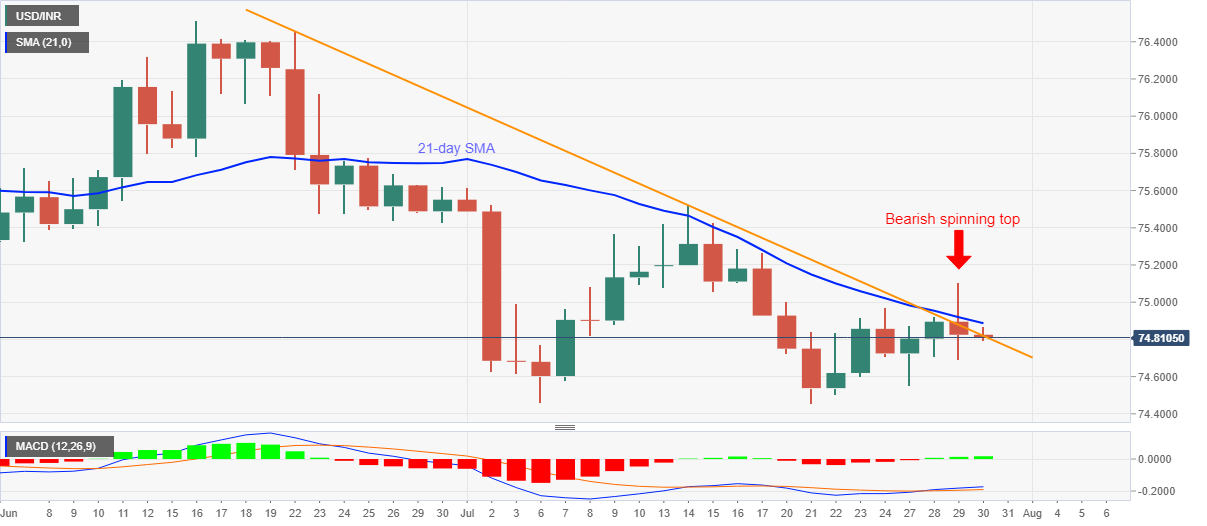
USD/INR picks up the bids around 74.84 during the initial Indian session on Thursday. The pair formed a bearish candlestick, spinning top, the previous day. However, the latest pullback from the monthly support line seems to question the further downside.
Even so, a 21-day SMA level of 74.88 restricts the pair’s nearby upside, which in turn holds the gate for the pair’s rise towards 75.00 and July 14 high of 75.51.
It should, however, be noted that the pair needs to close past-75.10 to confirm the negligence of the previous day’s candlestick formation.
On the downside, 74.60 and lows marked on July 06 and 21 around 74.45 become the strong support to watch.
If the bears dominate below 74.45, March 27 bottom of 74.15 and 74.00 round-figure will pop-up on their radar.
USD/INR daily chart
Trend: Pullback expected
