- USD/INR bounces off horizontal support stretched since early-August.
- The pair stays below near-term key resistance confluence.
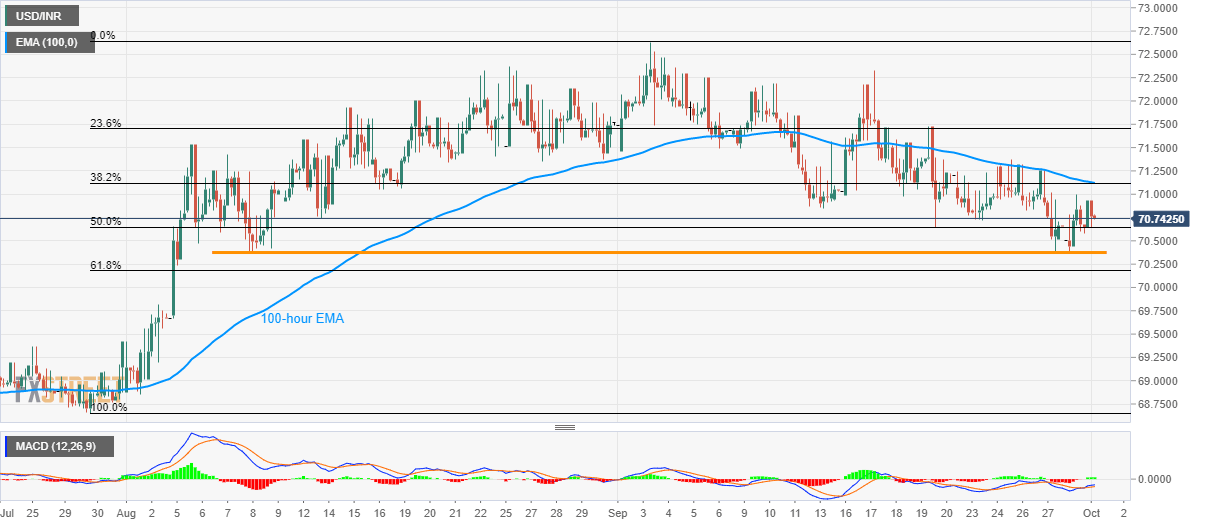
Despite bouncing off near-term key support-line, USD/INR stays below a confluence of 100-day exponential moving average (EMA) and 38.2% Fibonacci retracement as it trades near 70.75 while heading into the European session on Tuesday.
The pair needs to clear 71.10/15 resistance-zone in order to justify strength to confront 23.6% Fibonacci retracement of July-September upside, at 71.70.
However, pair’s further upside could be challenged by 72.20, failing to which might please bulls with 72.65.
Meanwhile, a downside break of 70.40/35 horizontal-support can quickly drag the quote below 70.00 round-figure to August 02 high nearing 69.80.
It should also be noted that pair’s south-run below 69.80 might not hesitate to avail late-July high close to 69.40, followed by July-end low around 68.65, as consecutive rest-points.
USD/INR 4-hour chart
Trend: pullback expected
