- Repeated failures to cross 100-DMA portray USD/INR weakness.
- Downward sloping RSI favors further declines with 21-DMA likely offering a pullback.
Despite trading below 100-DMA, the 21-day moving average (DMA) restricts USD/INR declines as it takes the rounds to 68.7500 while heading into the European session on Tuesday.
Should a downward sloping 14-day relative strength index (RSI) drags the quote below 68.7390 DMA support, 68.57/58 and 68.25 can come back on the chart.
Meanwhile, 23.6% Fibonacci retracement of May – July drop, at 68.89, seem nearby resistance, a break of which may trigger fresh upside targeting 69.10 and 69.29/30 area comprising 38.2% Fibonacci retracement level and 100-DMA.
If at all prices rally past-69.30, buyers may rush towards 70.00 round-figure during the further rise.
USD/INR daily chart
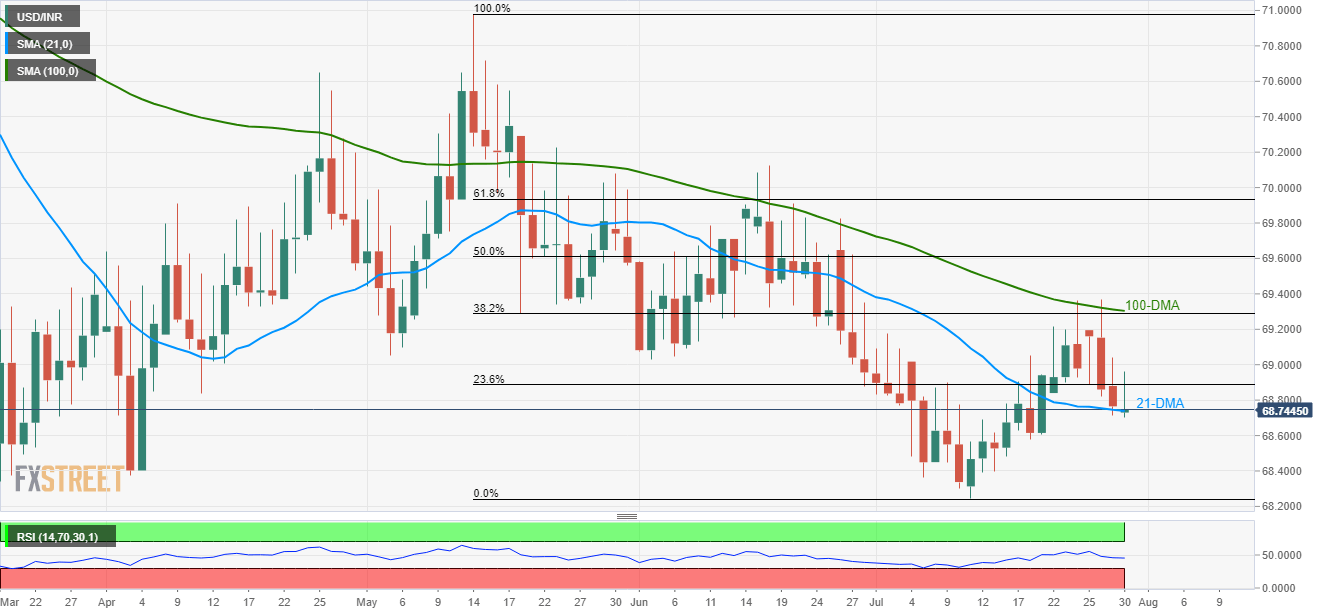
Trend: Pullback expected
