- 23.6% Fibonacci retracement and 50-day EMA question immediate upside of USD/INR.
- Near-term descending trend-line and 69.65/70 confluence also challenge bulls.
Despite recent recovery, USD/INR remains below key immediate resistances as it takes the rounds to 68.78 ahead of the European open on Friday.
Among them, 50-day exponential moving average (EMA) and 23.6% Fibonacci retracement of February to July decline, around 69.10/15, offers the closest upside barrier, a break of which further propel prices to the 9-week old resistance-line at 69.36.
However, pair’s rise beyond 69.36 might struggle unless clearing the 69.65/70 confluence including 38.2% Fibonacci retracement and 200-day EMA.
On the downside, 68.38/36 seems the strong support before the latest low surrounding 68.25. Should bears dominate below 68.25, 68.00 could be on their radar.
USD/INR daily chart
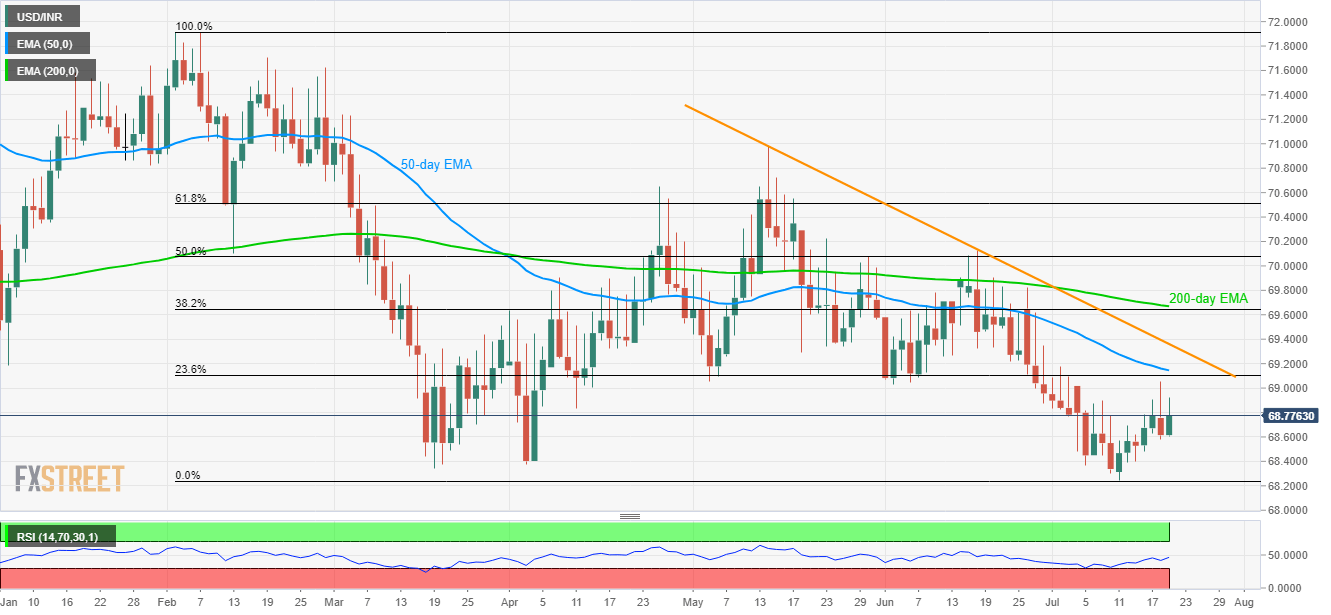
Trend: Bearish
