- USD/INR fails to remain strong around multi-month high.
- Overbought RSI, bearish MACD signal buyers’ exhaustion.
- 23.6% Fibonacci retracement, 21-DMA and four-week-old support-line becomes the key to watch.
USD/INR witnesses a pullback as it takes the rounds to 71.95 ahead of Thursday’s European open.
Not only the bearish signal by 12-bar moving average convergence and divergence (MACD) indicator but overbought conditions of 14-day relative strength index (RSI) also increases the odds of a pair’s pullback.
In doing so, it can test 71.62/56 confluence including 21-day simple moving average (DMA), 23.6% Fibonacci retracement of July-September upside and four-week-old rising trend-line.
If more sellers sneak in around 71.55, an area including mid-May high and 38.2% Fibonacci retracement between 71.00 and 70.97 could entertain them ahead of pushing towards 50-DMA level of 70.10.
Meanwhile, an upside clearance of 72.63 opens the door for the pair’s fresh run-up towards December 2018 top near 72.82 and then to 73.00 round-figure whereas October 2018 top surrounding 74.10 could please the bulls afterward.
USD/INR daily chart
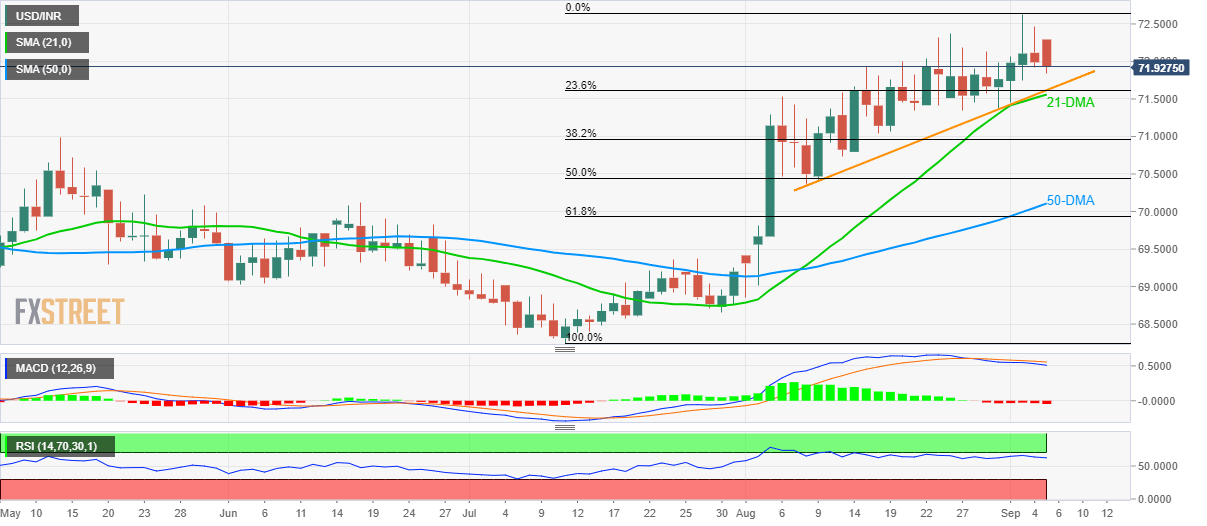
Trend: pullback expected
