USD/INR is looking south, having dived out of the 4-hour chart ascending channel yesterday.
The relative strength index (RSI) on the 4-hour chat is biased bearish below 50.00, having breached the rising wedge to the downside last week.
Even so, a re-test of the recent low of 68.34 may not happen today as oil importers may put a bid under the US dollar, tracking oil’s rally to four-month highs.
That said, the immediate bias would remain bearish while the pair is held below 69.35. The USD/INR pair is currently trading at 68.60.
4-hour chart
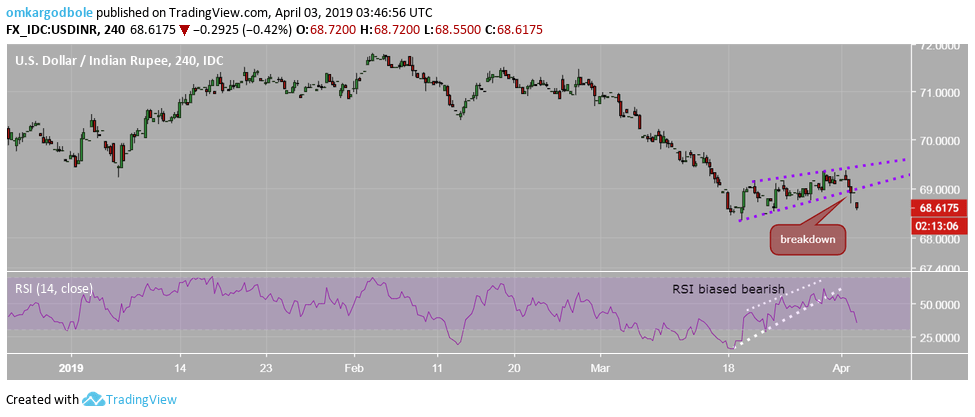
Trend: Cautiously bearish
