USD/INR closed well below the 200-day moving average (MA) yesterday, bolstering the bearish setup, as indicated by the range breakdown, descending 5- and 10-day moving averages (MAs) and RSI below 50.
More importantly, the 200-day MA – now a resistance – has reversed spike seen earlier today, further reinforcing the bearish view.
The pair, therefore, risks falling below the immediate support at 70.392 (Feb. 13 low). A violation there would expose 70.00.
A close above the 10-day MA, currently at 70.89, would invalidate the bearish setup.
Daily chart
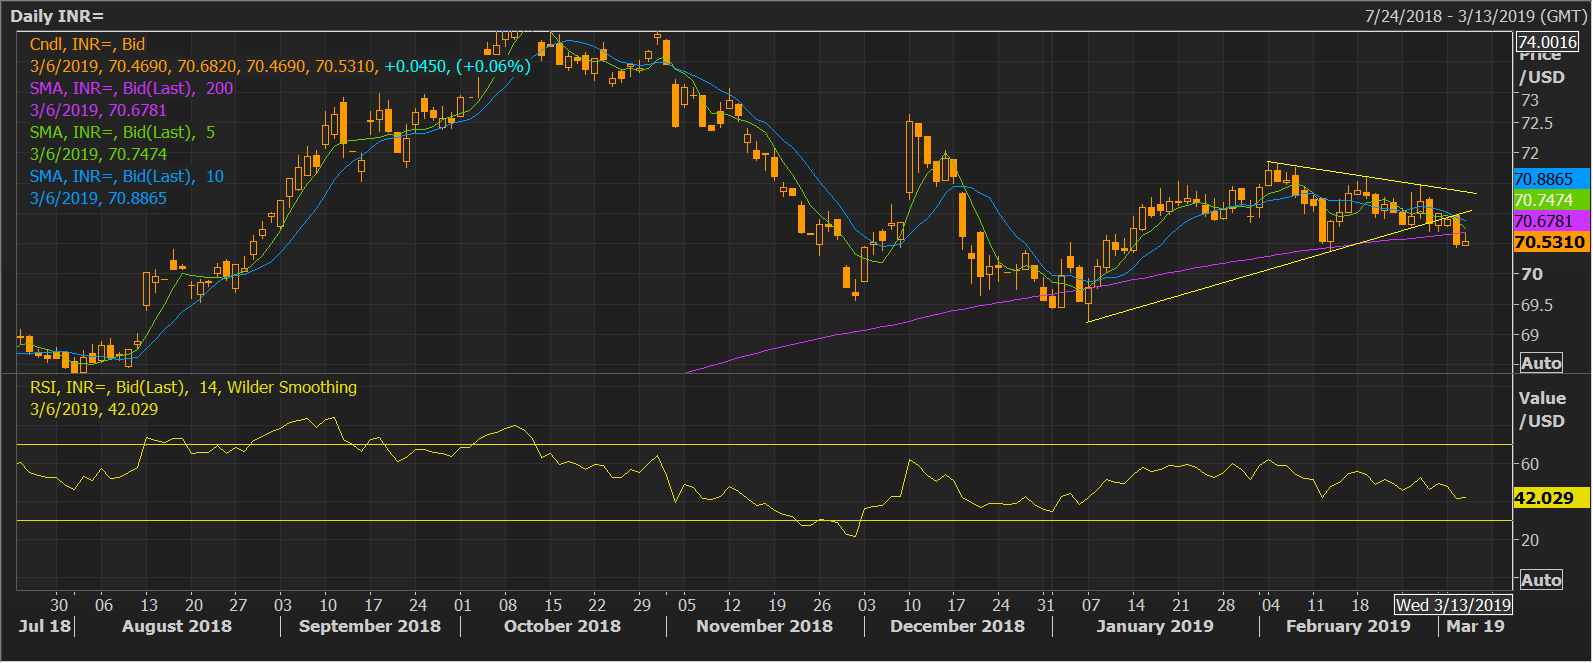
Trend: Bearish
