- USD/INR repeatedly bounces off the 70.70/76 area since the month’s start.
- 61.8% Fibonacci retracement adds to the resistance.
Although USD/INR registers repeated bounces off 70.70/76 area since the month’s start, pair’s sustained trading below 200-bar SMA and a seven-week-old falling trend line portrays the pair’s weakness. By the press time of the pre-European session on Wednesday, the quote trades around 71.00.
While 200-bar Simple Moving Average (SMA) near 71.20 acts as immediate upside resistance, a downward sloping trend line since early-September, around 71.60, and 61.8% Fibonacci retracement level of September month downpour, at 71.77, could limit pair’s further advances.
Should prices keep rising past-71.77, also clear 71.80 round-figure, 72.30 and September month high close to 72.65 will lure bulls.
Alternatively, pair’s declines below 70.70, can recall September 27 low adjacent to 70.35. Though, 70.00 and late-July highs close to 69.40 could question sellers afterward.
USD/INR 4-hour chart
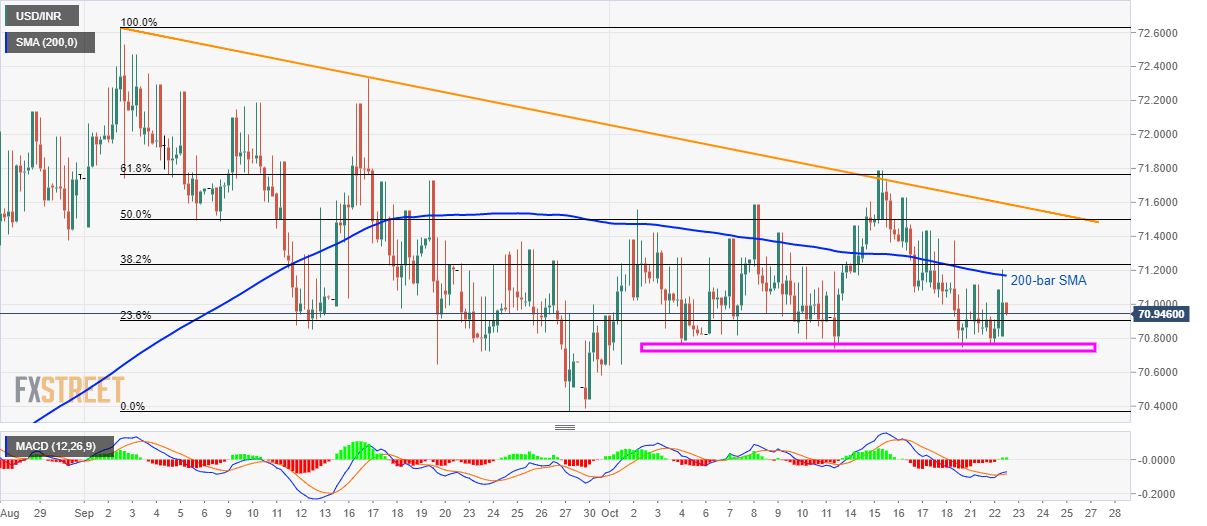
Trend: bearish
