- The nearby resistance-confluence limit short-term upside, indicating pullback to 50-day SMA.
- Broad symmetrical triangle in place to confine additional moves.
Having failed to clear near-term resistance confluence, USD/INR sellers aim for 50-day SMA as it takes the round to 69.78 during early Monday.
During the pair’s decline past-69.64 support, comprising 50-day simple moving average (SMA), latest lows near 69.28 and six-week-old ascending trend-line at 69.14 can come back on the chart.
It should, however, be noted that the quote’s downturn below 69.14 could open fresh leg down to current month low near 69.03 ahead of diverting bear to 68.70 and 68.34 rest-points.
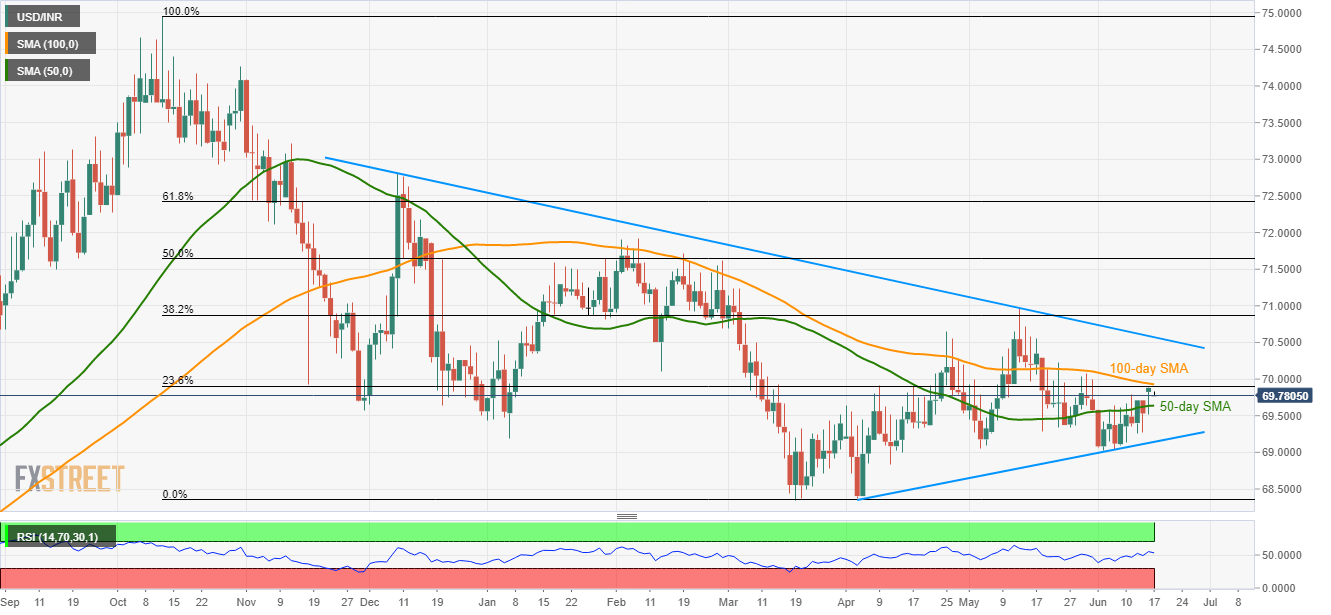
If at all buyers successfully manage to cross 69.91/93 resistance-confluence, 70.23 and six-month-old downward sloping trend-line at 70.57 might lure them.
Assuming prices rally beyond 70.57, May month top surrounding 71.00 could be targeted if holding a long position.
USD/INR daily chart
Trend: Pullback expected
