- USD/INR stays below the one-week-old falling trend line.
- 50-bar EMA has been limiting the pair’s downside since November 07.
- The month-start top will follow the breakdown.
USD/INR remains below near-term resistance line while still managing to trade beyond 50-day EMA. That said, the quote takes rounds to 71.75 by the early Asian session on Friday.
While an upside clearance of a one-week-old falling trend line, at 72.00, will trigger fresh run-up to the monthly top surrounding 72.38. pair’s declines below 50-bar Exponential Moving Average (EMA) level of 71.72 can drag prices to the November 01 high near 71.30.
Additionally, the September month high near 72.65 and the 70.37/36 area, including lows marked on August 08 and also in September, could entertain traders during the pair’s break of either 72.38 or 71.30 respectively.
It should also be noted that the 14-bar Relative Strength Index (RSI) has been under pressure off-late, which in turn favors sellers more than otherwise.
USD/INR 4-Hour chart
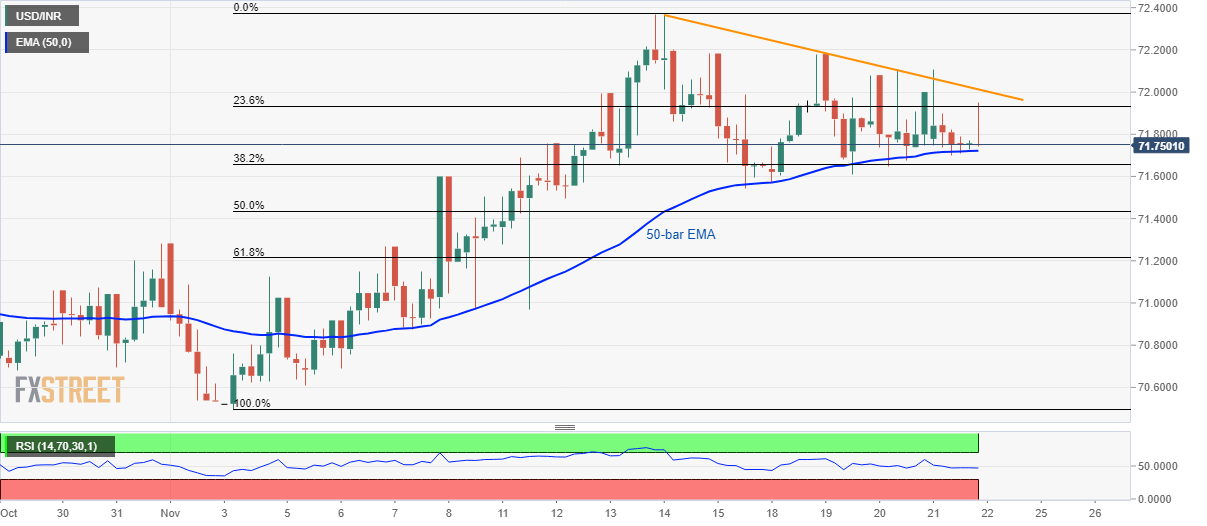
Trend: Sideways
