- USD/JPY steps back from intraday top while marking indecisiveness on a third consecutive day off in Japan.
- Normal RSI conditions keep buyers hopeful unless breaking immediate key supports.
- Monthly horizontal area becomes a crucial hurdle to the north.
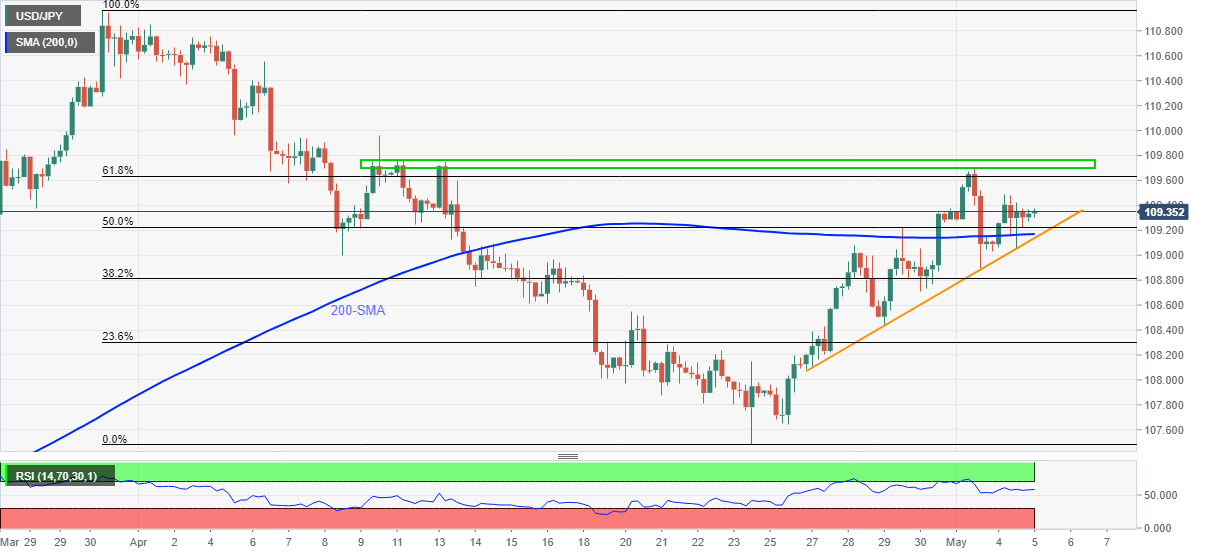
USD/JPY eases to 109.35, revisiting the day’s opening levels, amid early Wednesday. Even so, the yen pair remains above 200-SMA and an ascending support line from April 26 to keep the buyers hopeful amid a quiet session in Asia, mainly due to holidays in China and Japan.
The RSI line’s steady moves above 50.00 also back the USD/JPY bulls targeting 109.50 nearby resistance.
Though, 61.8% Fibonacci retracement of March-April downside and a horizontal area comprising multiple tops marked since early April, respectively around 109.60 and 109.70-75, will be tough nuts to crack for the pair before confirming further upside.
Meanwhile, a 50% Fibonacci retracement level of 109.22 can restrict further declines ahead of highlighting the 109.17-13 support zone that includes the stated SMA and rising trend line.
Overall, USD/JPY remains lackluster but well in the vicinity of buyer’s catch.
USD/JPY four-hour chart
Trend: Further upside expected

