- USD/JPY takes U-turn from the monthly resistance line.
- Aims to revisit 23.6% Fibonacci retracement.
- Bullish MACD questions further decline.
While reversing from a short-term falling trend line, USD/JPY declines to 104.80, down 0.80%, amid the initial trading hours on Wednesday.
The pair currently drops towards 23.6% Fibonacci retracement of its declines from February 22, at 103.75.
However, its further downside can be challenged by bullish MACD, which if ignored could recall 102.90 and 102.00 levels on the chart.
In a case of the bears’ dominance past-102.00, the monthly low near 101.20 and 100.00 psychological magnet should be in the spotlight.
Alternatively, the pair’s ability to cross the immediate resistance line, at 105.75 now, cannot be considered as a sign of its strength as another falling trend line from February 21, around 107.00.
Also increasing the filters to the pair’s run-up are 61.8% Fibonacci retracement level of 108.00 and 200-bar SMA of 108.95.
USD/JPY four-hour chart
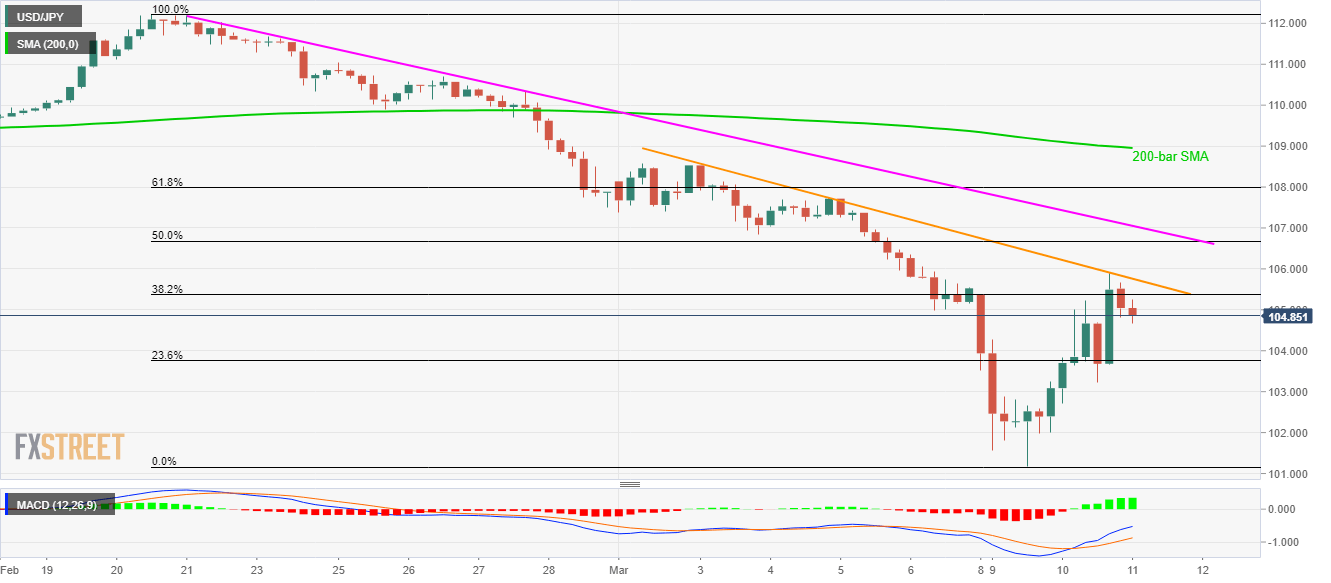
Trend: Bearish
