- USD/JPY is starting to decelerate on the daily and 4-hour time frames.
- Bulls may still have an appetite towards the 106 area.
- A correction of the massive bullish impulse is inevitable, but it is still too bullish to presume an imminent reversal.
JPY net long positions had dropped after their recent push to the highest levels since October 2016 which is transpired in the spot market following a breakout of the longterm bearish dynamic resistance.
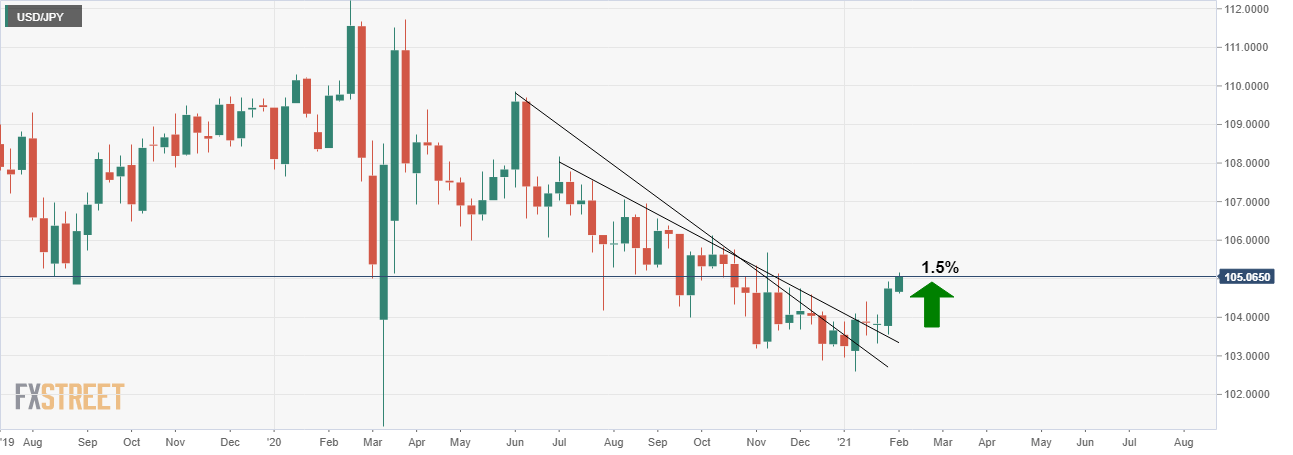
(Daily Chart).
The unwind in the yen could be related to a behind the scenes reflation trade as outflows head into to higher-yielding foreign assets.
Nevertheless, the technical picture is compelling and the following is a top-down analysis that illustrates where the next trading opportunity could be derived from a swing trading perspective.
Monthly chart
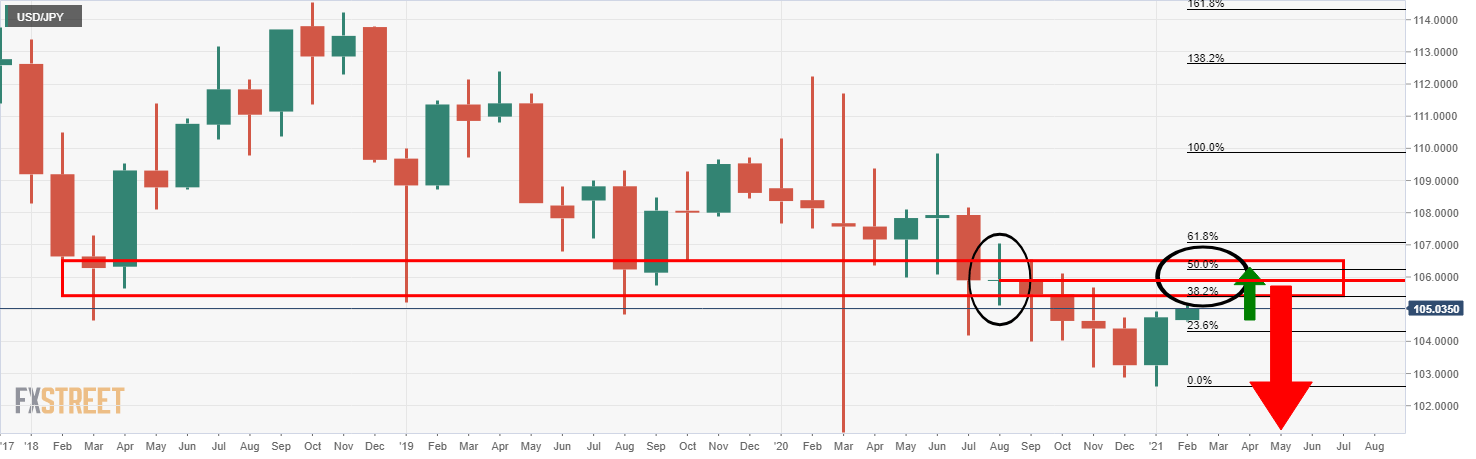
The monthly chart is showing a strong resistance area where the price was supported numerous times in the past.
This would be expected to now act as resistance.
However, it is worth noting that within the monthly bearish trend, there is one candle that is opposing, which for ease of identifying, it has been eclipsed on the above chart.
Interestingly, this candle is inline with the 38.2% and 50% Fibonacci’s of the bearish trend and could well be targetted yet at 105.74.
It is also the last stop on the daily and weekly chart in terms of confluences of the daily pivot point and weekly R2.
Below this is shown on the FXStreet Technical Confluences Indicator:
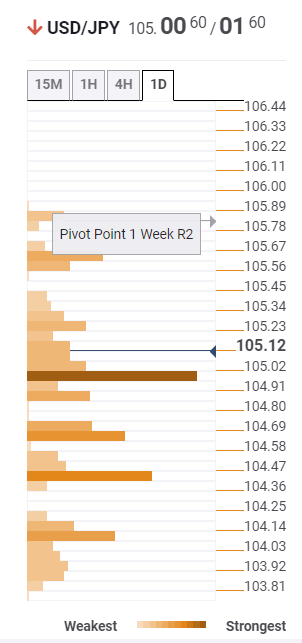
About Confluence Detector
The TCI (Technical Confluences Indicator) is a tool to locate and point out those price levels where there is a congestion of indicators, moving averages, Fibonacci levels, Pivot Points, etc. Knowing where these congestion points are located is very useful for the trader, and can be used as a basis for different strategies.
Weekly chart
The weekly chart shows the prior highs are a little higher up, but we can be assured that the 105.70/10 area is going to be critical and could ignite strong supply.
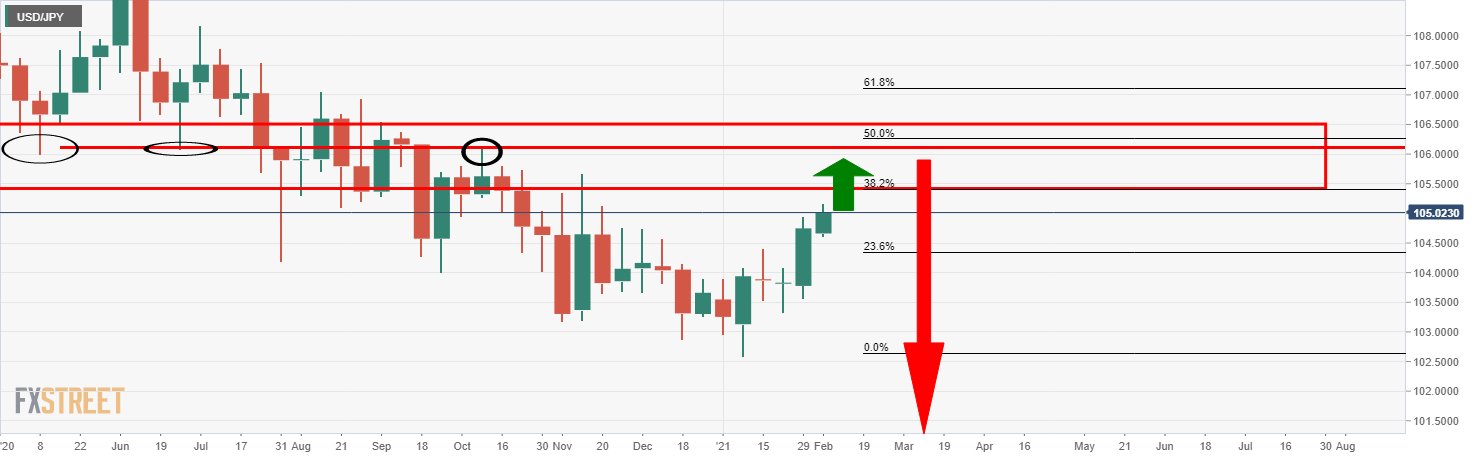
Daily chart
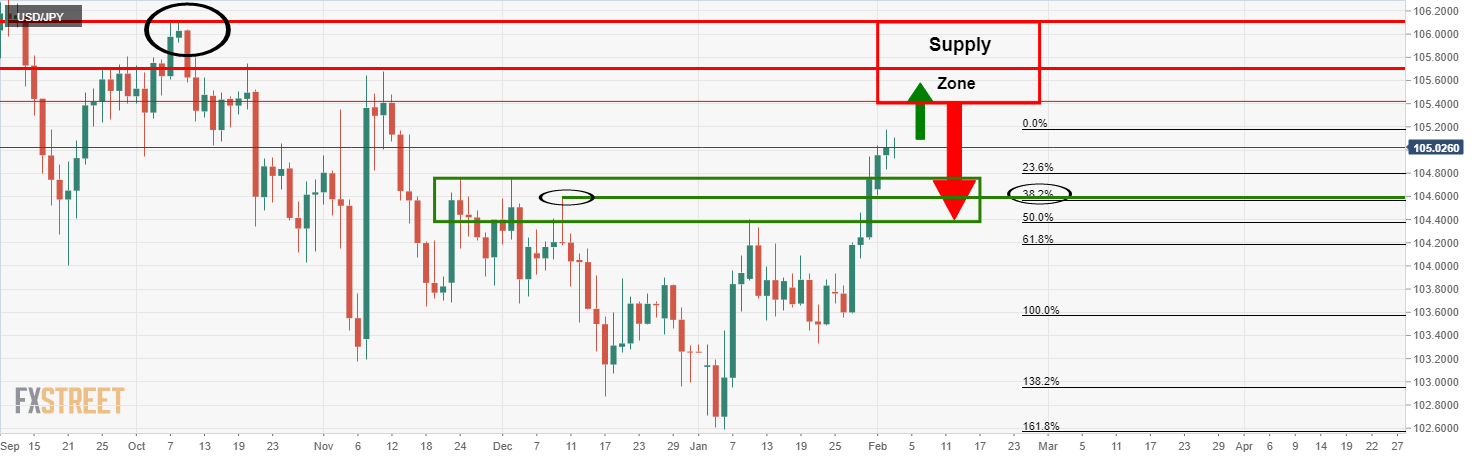
The daily chart is showing signs of deceleration of the massive bullish impulse, but there is still some way to go until the Supply Zone and said levels on the monthly and weekly time frames.
Nevertheless, should the price fail to move higher, and start the correction prematurely, then as it stands, the Fibonacci levels of the current daily bullish impulse’s range align with prior resistance looking left.
A 38.2% Fibonacci aligns with the 10th Dec highs at 104.58 and the 50% with the 11th Jan highs of 104.40.
4-hour chart
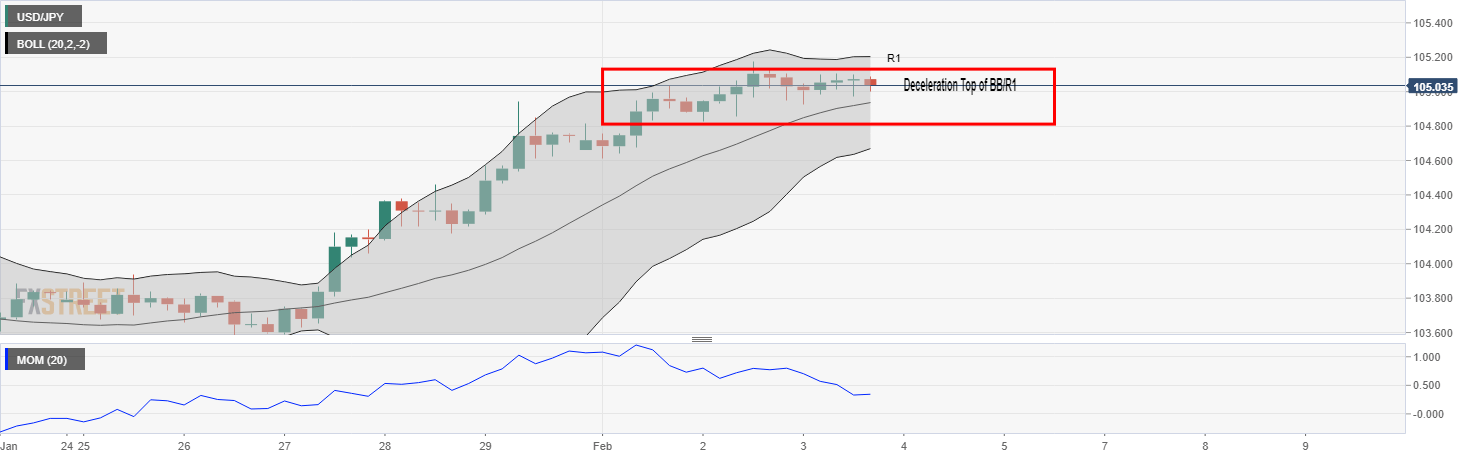
The 4-hour chart shows the deceleration of price and momentum at a confluence of the top of the Bolinger Band that meets R1.
If the price can break here, then the upside targets will be the focus for a higher level to short from to target at least a 38.2% Fibo of the weekly rally.
On the other hand, if the bearish stricture is forme don the 40hour chart, then a lower probability trade can target the same downside levels.
