- USD/JPY is hanging near 10-month highs in the New York session.
- The level to beat for bulls is the 112.125 resistance.
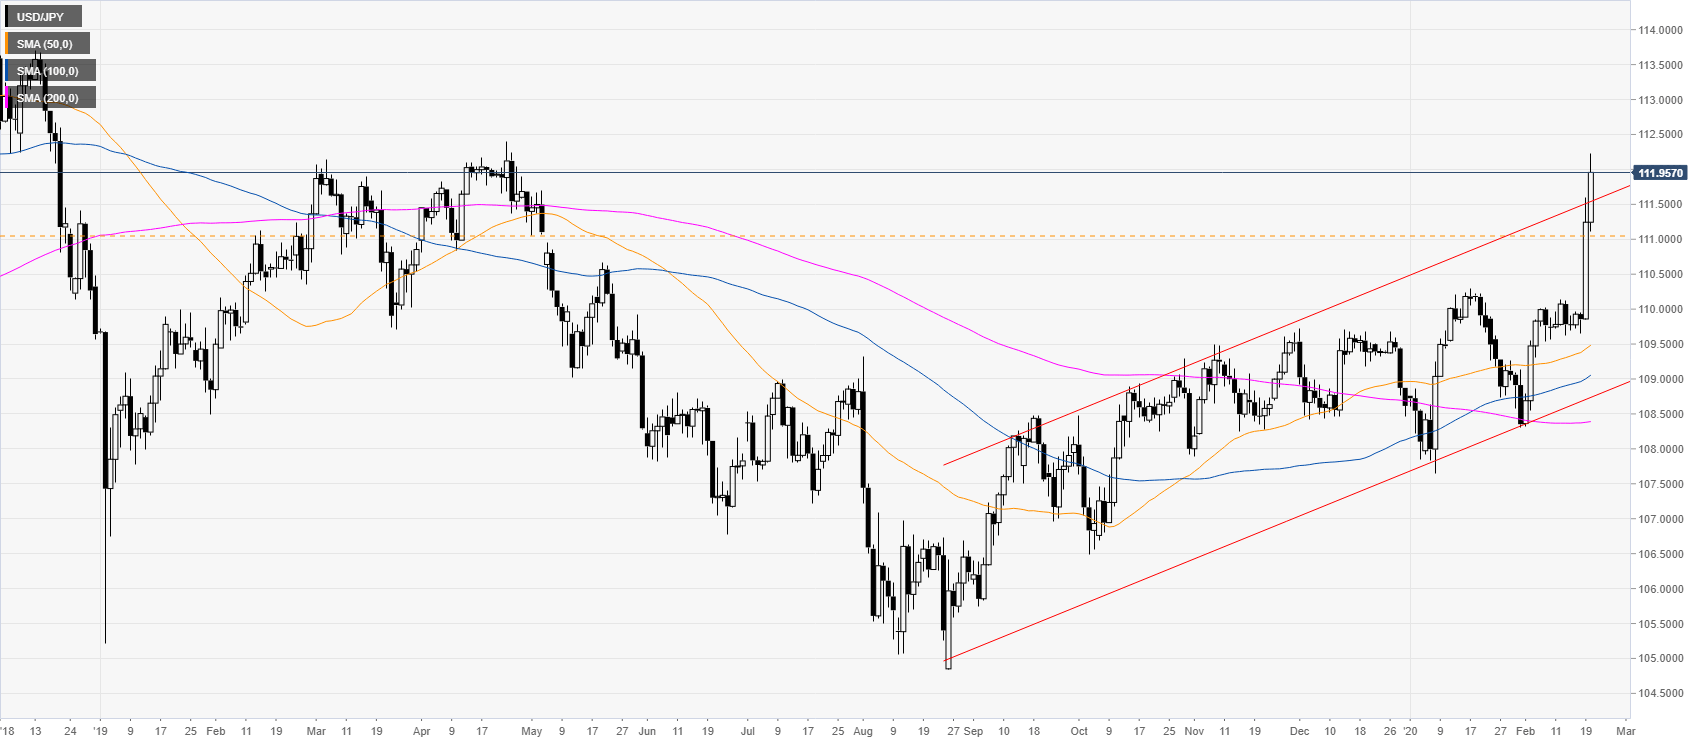
USD/JPY daily chart
USD/JPY broke above a bull channel while above the main daily simple moving averages (SMAs). The spot is again having an above-average intraday rally for the second consecutive day.
USD/JPY four-hour chart
USD/JPY is trading at ten-month highs as the market is spiking well above the main SMAs. USD/JPY is consolidating above-average gains near the 112.00 figure. Bulls are looking for an extension of the bull move above the 112.15 resistance en route towards the 112.40 and 112.62 levels. Dips could find support near the 112.00, 111.45 and 111.21 levels, according to the Technical Confluences Indicator.
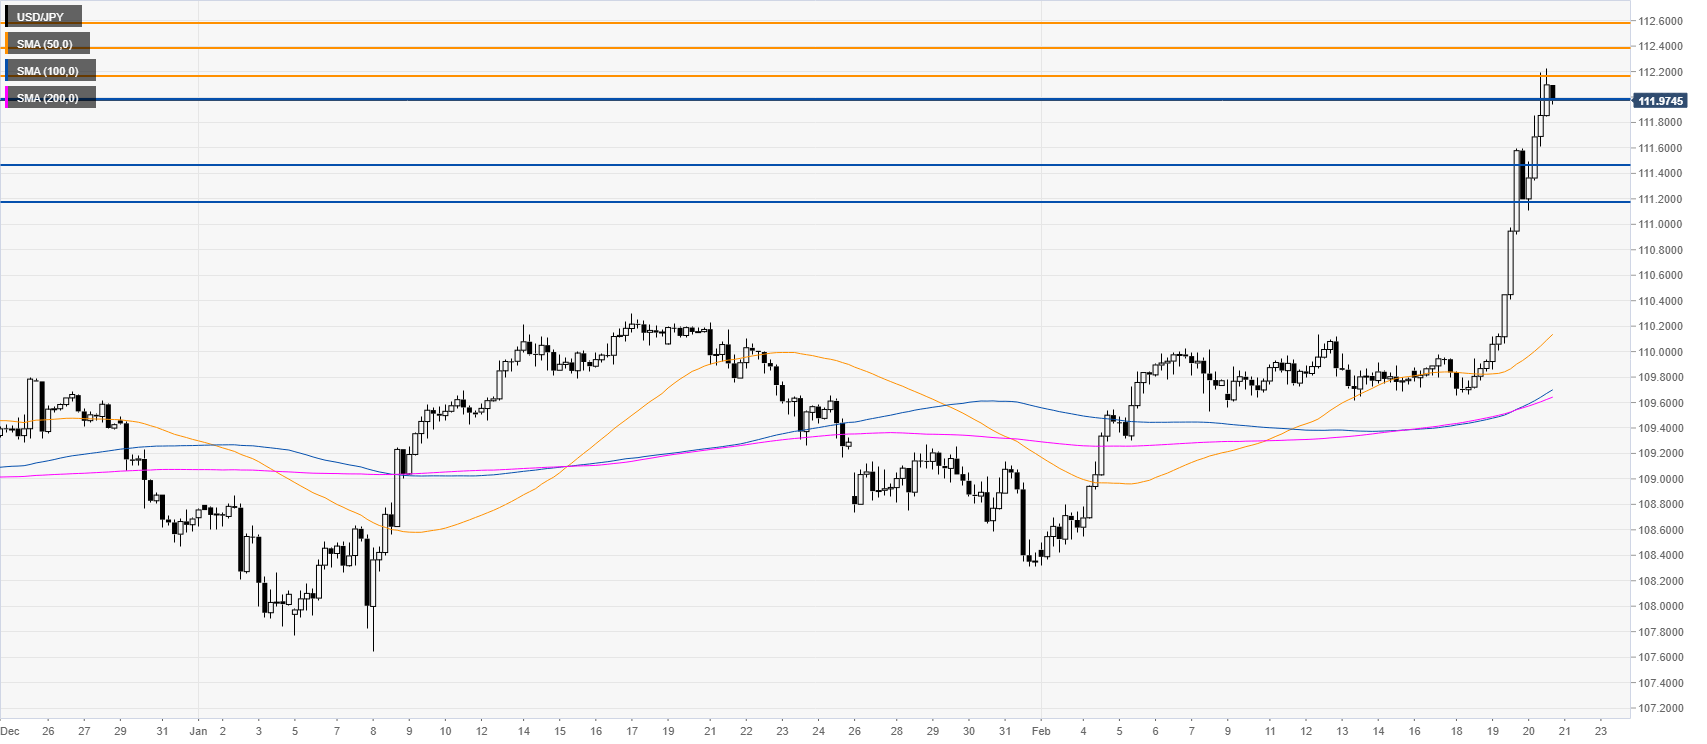
Resistance: 112.15, 112.40, 112.62
Support: 112.00, 111.45, 111.21
Additional key levels
