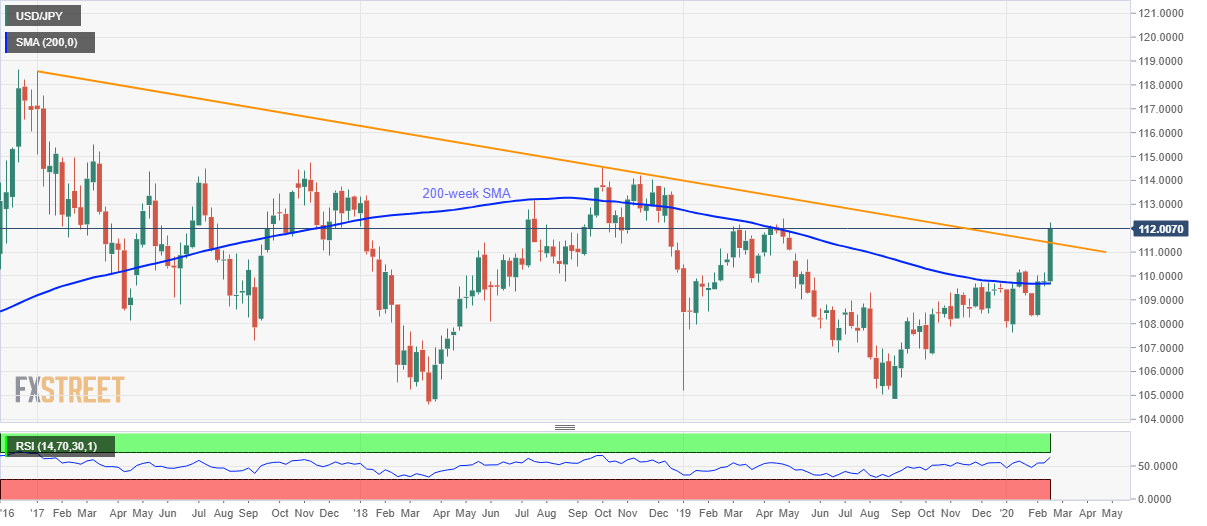
- USD/JPY struggles to rise beyond a 10-month high.
- The quote pierces a downward sloping trend line from January 2017, sustained break on a weekly basis can confirm further upside.
- 200-week SMA acts as key support.
USD/JPY steps back to 112.00, down 0.07%, during the pre-European session on Friday. Even so, the pair stays above the multi-month-old falling trend line on a weekly basis.
Should the pair closes the week beyond 111.40 resistance-turned-support, its run-up to 112.40 and November 2018 high near 114.20 can be expected.
During the pair’s extended rise past-114.20, October 2018 top surrounding 114.55 will be on the bulls’ radar.
Meanwhile, a downside break of 111.40 on the weekly closing basis can recall a 200-week SMA level of 109.70.
However, 111.00 and January 2020 peak close to 110.30 may offer intermediate halts to the declines.
USD/JPY weekly chart
Trend: Bullish

