- USD/JPY trades down despite broad-based USD strength.
- The level to beat for bears is the 105.70 support.
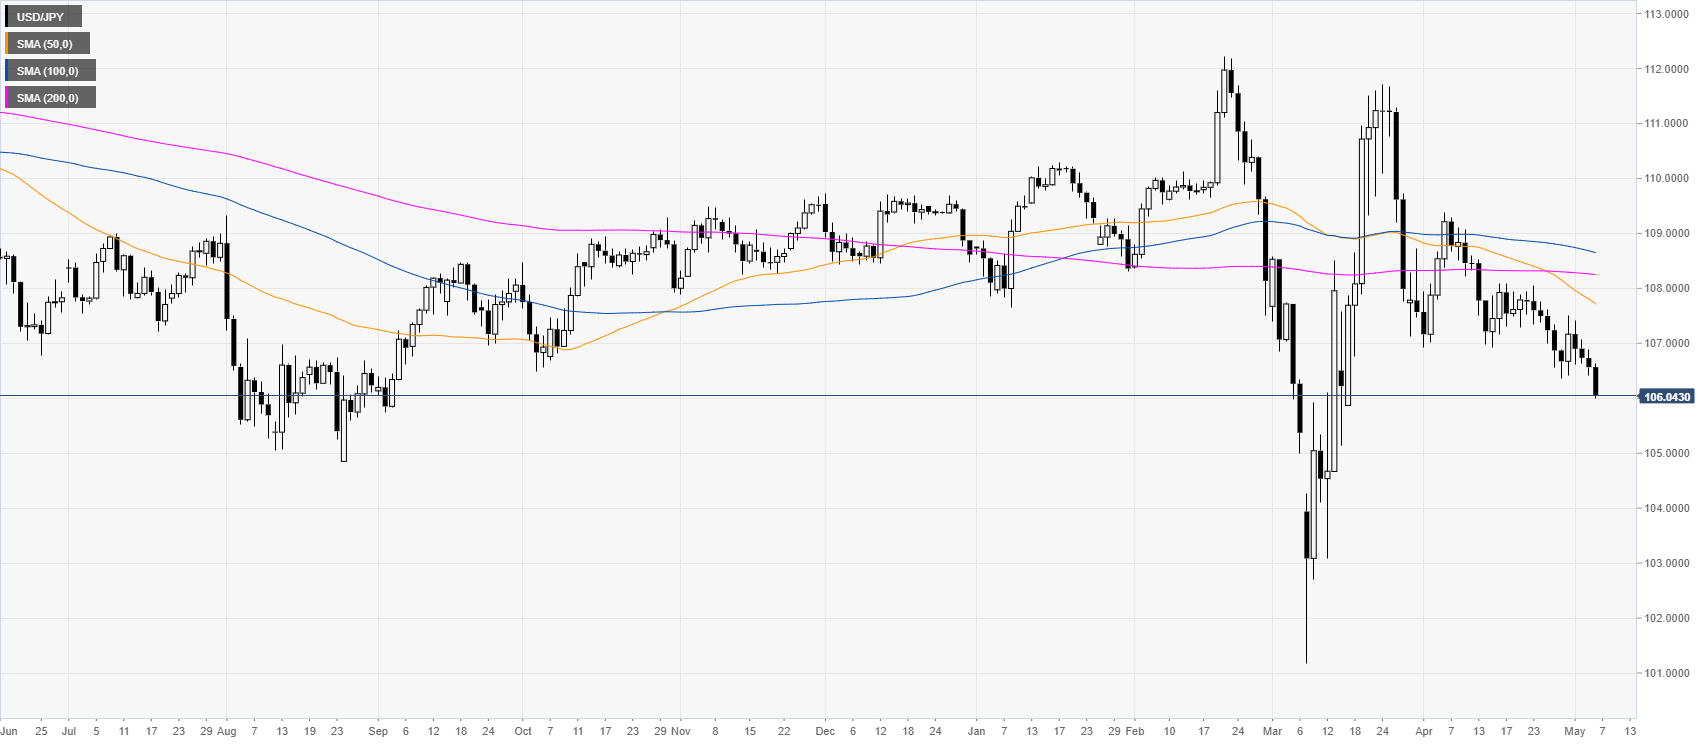
USD/JPY daily chart
USD/JPY gets another bearish day despite broad-based USD strength this Wednesday. The spot is trading below the main SMAs on the daily chart suggesting a bearish bias. Moreover, the 50 SMA crossed below the 200 SMA creating a death cross which can result in more downward traction for the currency pair.
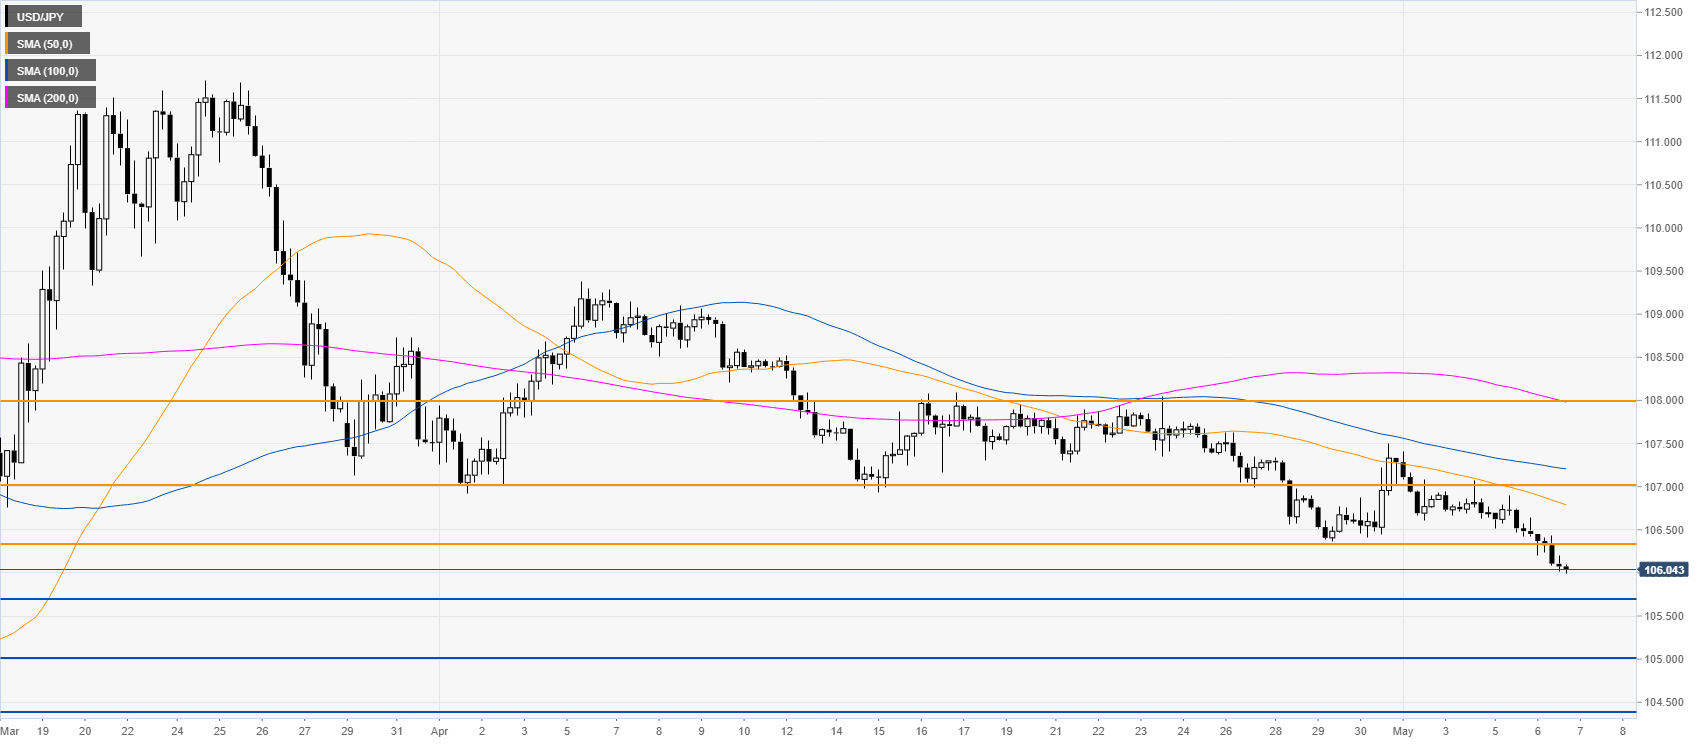
USD/JPY four-hour chart
USD/JPY is drifting down below its main SMAs on the four-hour chart as the spot is nearing the 106.00 figure. The market broke below the April lows and it seems that the bears are now in full control. A break below the 105.70 support can see more downside price movements. On the flip side, resistance is expected to hold near 106.30 and 107.00 resistances.
Additional key levels
