- USD/JPY is under heavy selling pressure near the November lows.
- The level to beat for bears is the 107.90/107.65 price zone.
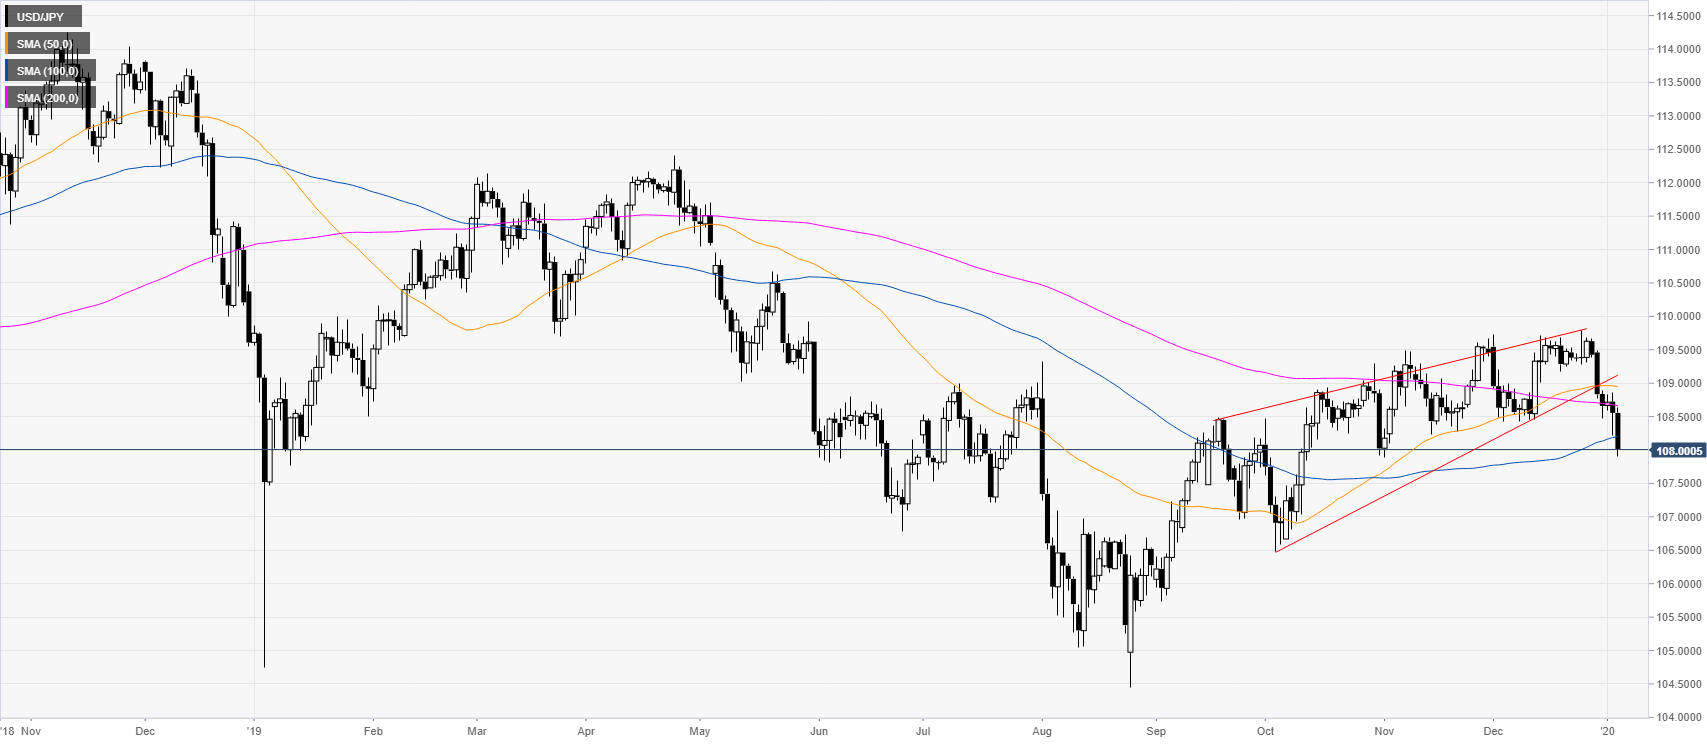
USD/JPY daily chart
USD/JPY is dropping from the December highs and the rising wedge formation. The spot is trading below the main daily simple moving averages (SMAs) near the 108.00 handle.
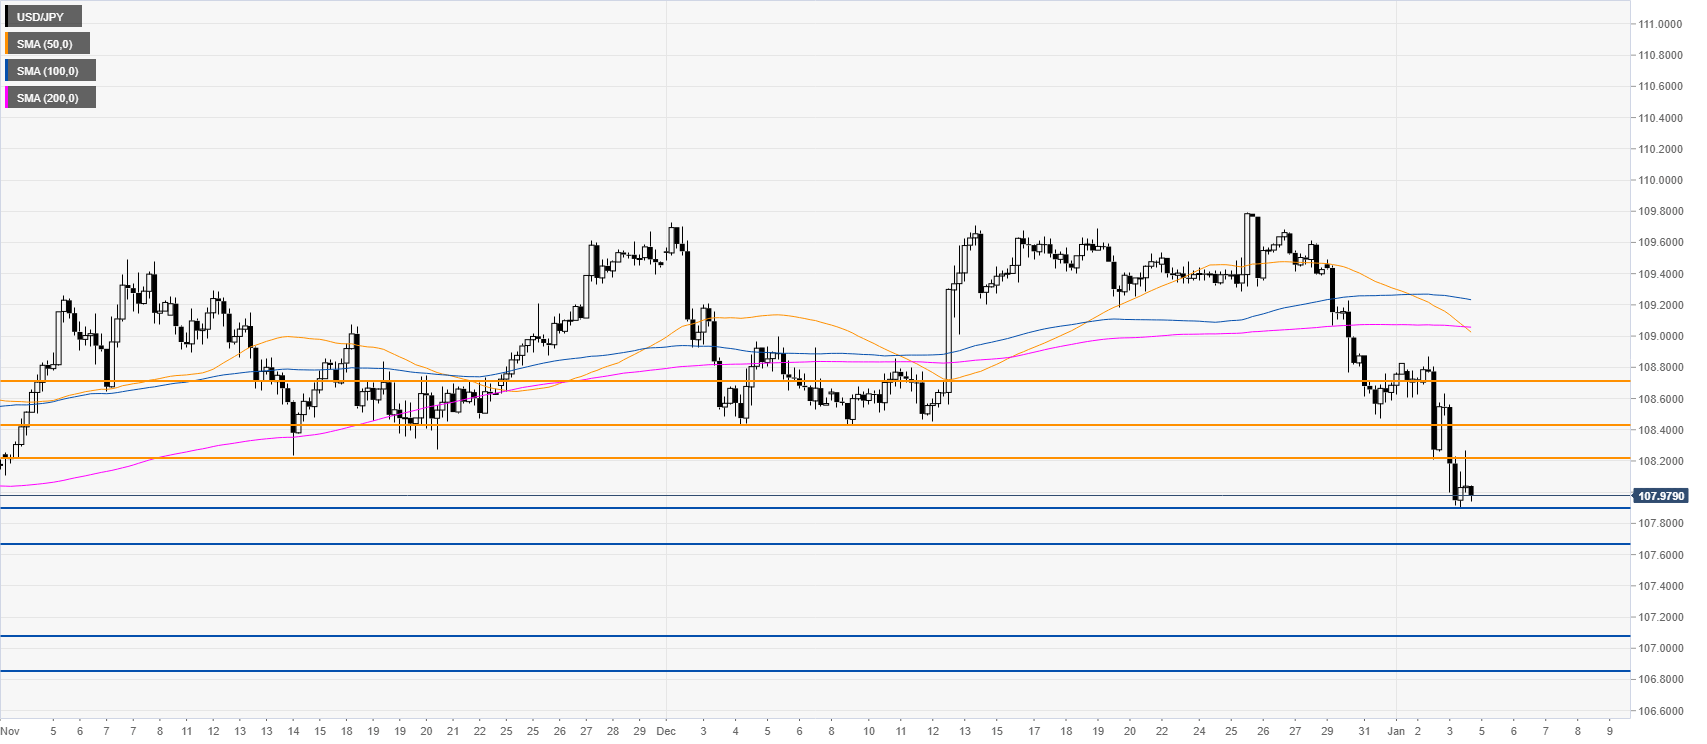
USD/JPY four-hour chart
The market remains under heavy bearish pressure below the main SMAs as pressuring the November lows near 107.90/107.65 price zone. A break below this area would likely open the doors to further losses towards 107.09 and 106.86 levels. Resistances are seen near the 108.21, 108.43 and 108.70 levels, according to the Technical Confluences Indicator.
Additional key levels
