- USD/JPY buyers battle resistance line of a short-term symmetrical triangle.
- 100 and 200-HMA add to the upside barriers
- Key Fibonacci retracements and January 06 raise bars for bears’ entry.
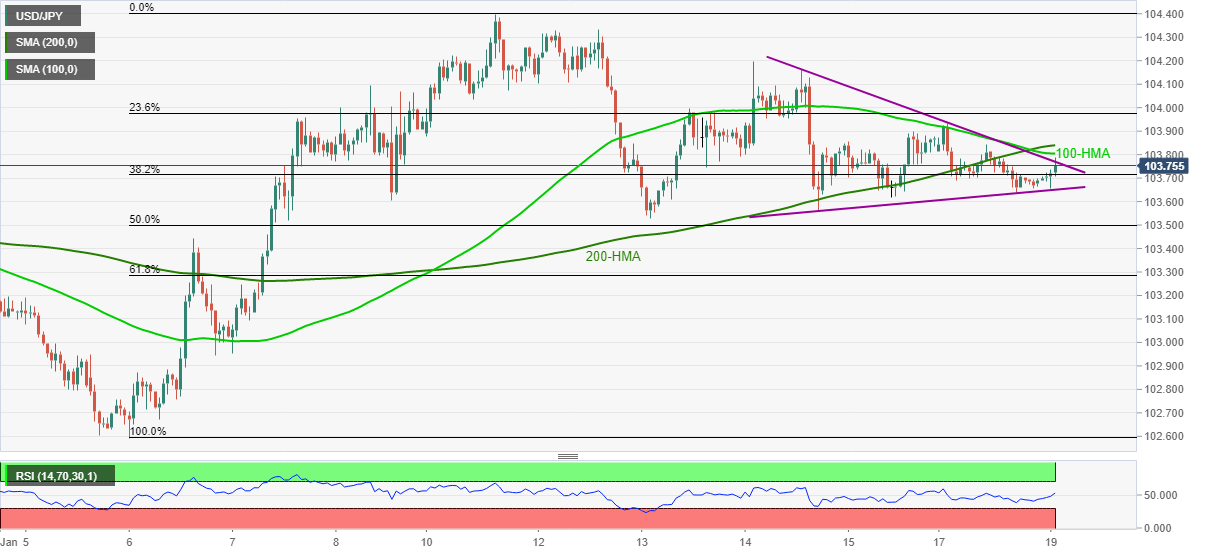
USD/JPY rises to 103.76, up 0.09% intraday, amid initial Tuesday trading in Tokyo. In doing so, the yen pair not only refreshes the intraday high but also probes a symmetrical triangle formation established since the last Thursday.
Although strong RSI conditions favor further USD/JPY upside, 100-HMA and 200-HMA, around 103.80/85, will challenge the bulls.
Also acting as an upside barrier is the 104.00 threshold and the monthly peak surrounding 103.40.
On the downside, the stated triangle’s support line, at 103.65 now, precedes 50% and 61.8% Fibonacci retracements of January 5-11 upside, respectively near 103.50 and 103.28, to restrict immediate declines of the quote.
Additionally, January 06 top near 103.45 offers extra support to stop USD/JPY sellers before directing them towards the monthly low of 102.60.
USD/JPY hourly chart
Trend: Pullback expected
