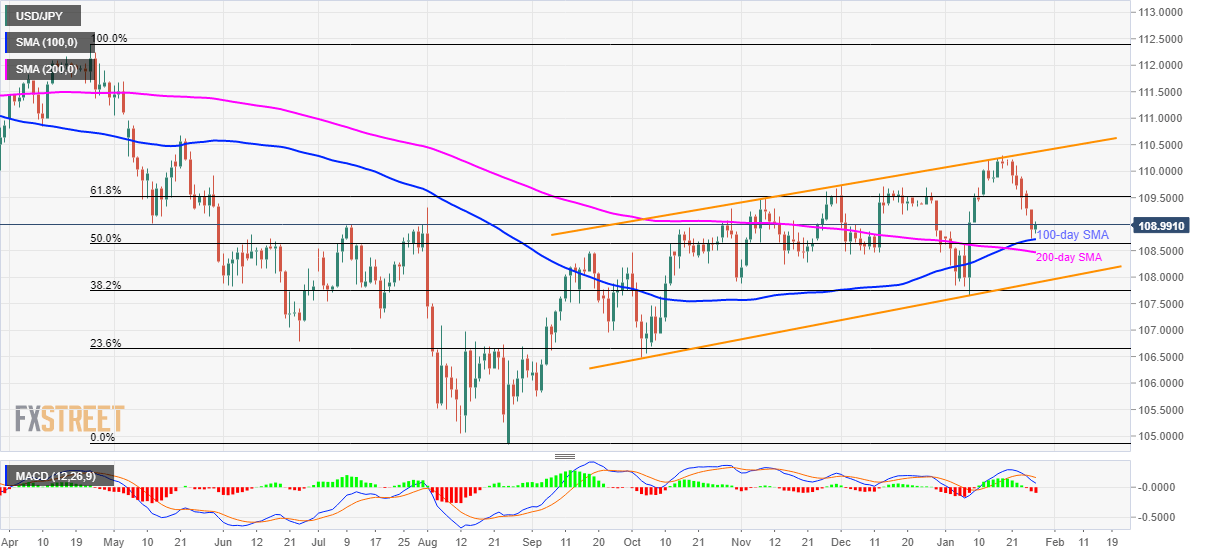
- USD/JPY recovers from nearly three-week low amid bearish MACD.
- 50% Fibonacci retracement, 200-day SMA add to the support.
- 61.8% of Fibonacci retracement offers short-term resistance.
USD/JPY pulls back from 100-day SM awhile taking the bids to 109.03 during early Tuesday. Following its declines below 61.8% Fibonacci retracement of April-August 2019 fall, the pair dropped to the lowest since January 08, amid bearish MACD, in recent days.
While 61.8% Fibonacci retracement, at 109.52, will act as the support-turned-resistance, 109.80 and 110.00 could entertain buyers ahead of making them confront the upper line of the trend channel stretched from early-October 2019, currently near 110.35.
Alternatively, pair’s declines below 100-day SMA level of 108.70 will be limited by 50% Fibonacci retracement and 200-day SMA, 108.60 and 108.45 respectively.
During the quote’s extended weakness under 108.45, the aforementioned channel’s support line near 107.90 will be the key to watch.
USD/JPY daily chart
Trend: Pullback expected

