- USD/JPY remains capped by key averages.
- The spot wavers in a potential descending triangle on the hourly chart.
- 103.56 is the level to beat for the bears.
After witnessing good two-way price swings on Thursday, USD/JPY is looking to stabilize below 104.00 in Friday’s Asian trading.
The spot bore the brunt of the dovish comments from the Fed Chair Powell while the US Treasury yields resumed its corrective decline.
So far this Friday, the greenback is attempting a tepid bounce, offering some support to USD/JPY. Markets await critical US Retail Sales and Consumer Sentiment numbers for fresh direction in the prices.
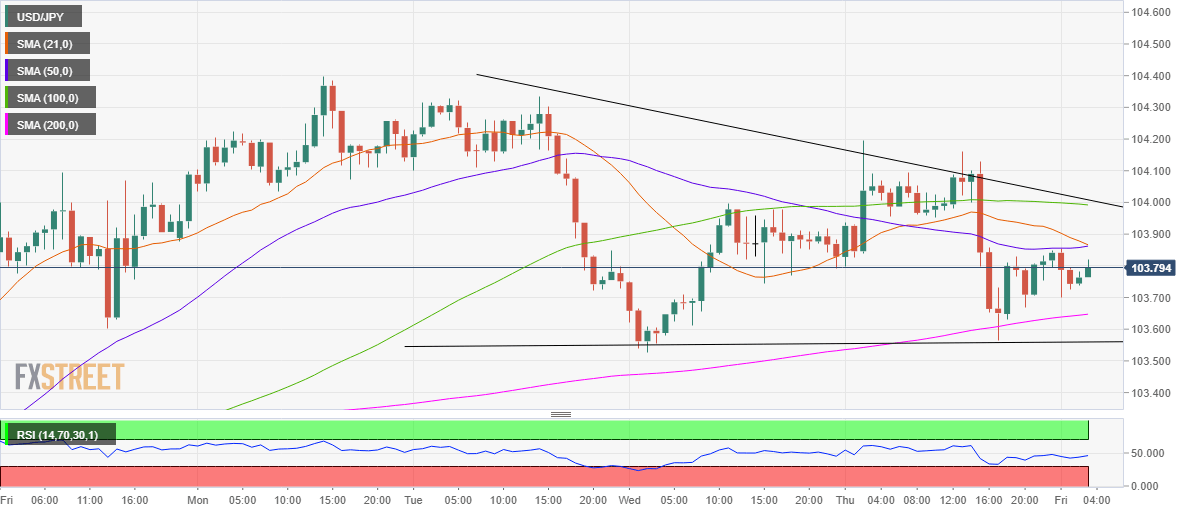
However, the immediate upside appears capped at 103.87, where the 21-hourly moving average (HMA) coincides with the 50-HMA, on the verge of forming a bearish crossover.
The price wavers in a descending triangle formation on the hourly sticks since Tuesday, with the buyers yearning to recapture the critical resistance at 104.00 to confirm the upside break.
That level is the meeting point of the horizontal 100-HMA and falling trendline resistance.
At the time of writing, the Relative Strength Index (RSI) edges higher but remains well below the midline, suggesting that the downside bias still remains intact.
The 200-HMA at 103.64 offers a strong cushion, below which the horizontal trendline support at 103.56 is the level to beat for the bears.
USD/JPY: Hourly chart
USD/JPY: Additional levels
