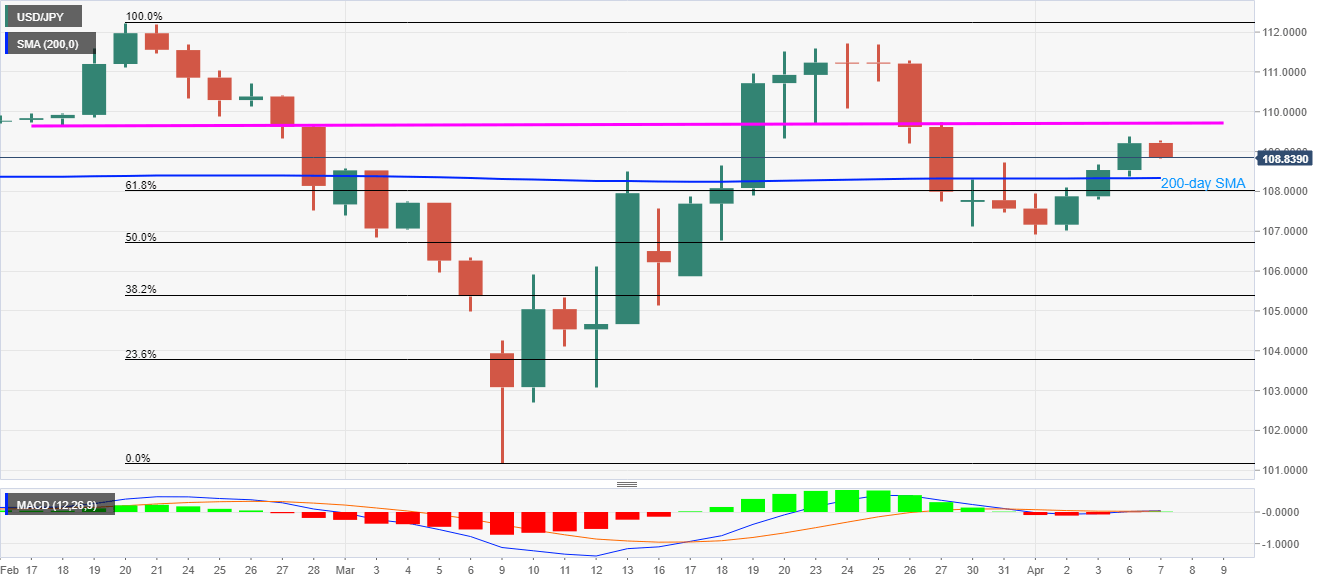
- USD/JPY pulls back from one-week high.
- 200-day SMA, 61.8% Fibonacci retracement restrict immediate downside.
- 109.65/70 seems to guard the immediate upside.
USD/JPY drops to 108.88, down 0.30% amid the Asian session on Tuesday. In doing so, the pair snaps the previous three-day winning streak but stays above the near-term key supports, namely 200-day SMA and 61.8% Fibonacci retracement of February-March declines.
Should the quote declines below 108.30 and 108.00 nearby supports, the month-start low near 106.90 could stop sellers from targeting a 50% Fibonacci retracement level of 106.70.
In a case where the bears dominate past-106.70, an area comprising March 05 low and March 10 low, around 106.00, will be the key.
Meanwhile, a horizontal region including multiple tops and bottoms since late-February around 109.65/70 will guard the pair’s near-term advances.
USD/JPY daily chart
Trend: Pullback expected

