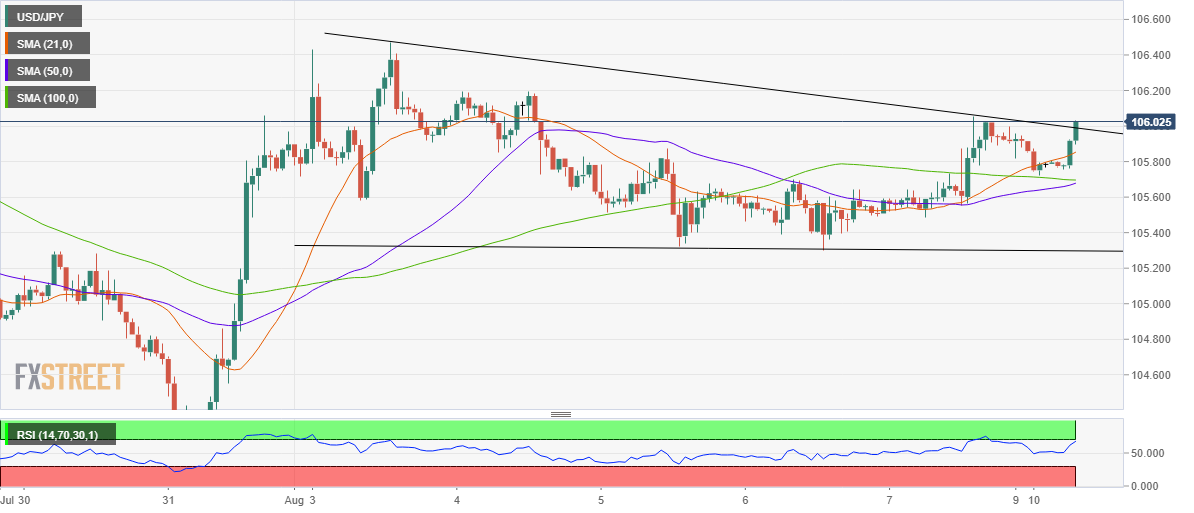
- USD/JPY charts descending triangle breakout on the hourly chart.
- Hourly RSI spikes to test the overbought region.
- Upside appears more compelling in the near-term.
After consolidating in a tight range around 105.80 in the Asian session this Monday, USD/JPY broke to the upside and conquered the 106 threshold.
The uptick in the spot can be explained by the descending triangle breakout spotted on the hourly chart following a break above the falling trendline resistance at 105.98.
The spike in the hourly Relative Strength Index (RSI) towards the overbought territory also adds credence to the renewed upside bias.
The spot has climbed above all the major HMAs, with the next upside target seen at 106.19 (August 4 highs), above which the August 3 high of 106.47 could be put to test.
Alternatively, the 21-hourly Simple Moving Average (HMA) at 105.85 could limit any pullbacks.
A break below the latter will call for a test of powerful support at 105.68, the confluence of the 50 and 100-HMAs.
All in all, the path of least resistance appears to the upside.
USD/JPY: Hourly chart
USD/JPY additional levels
