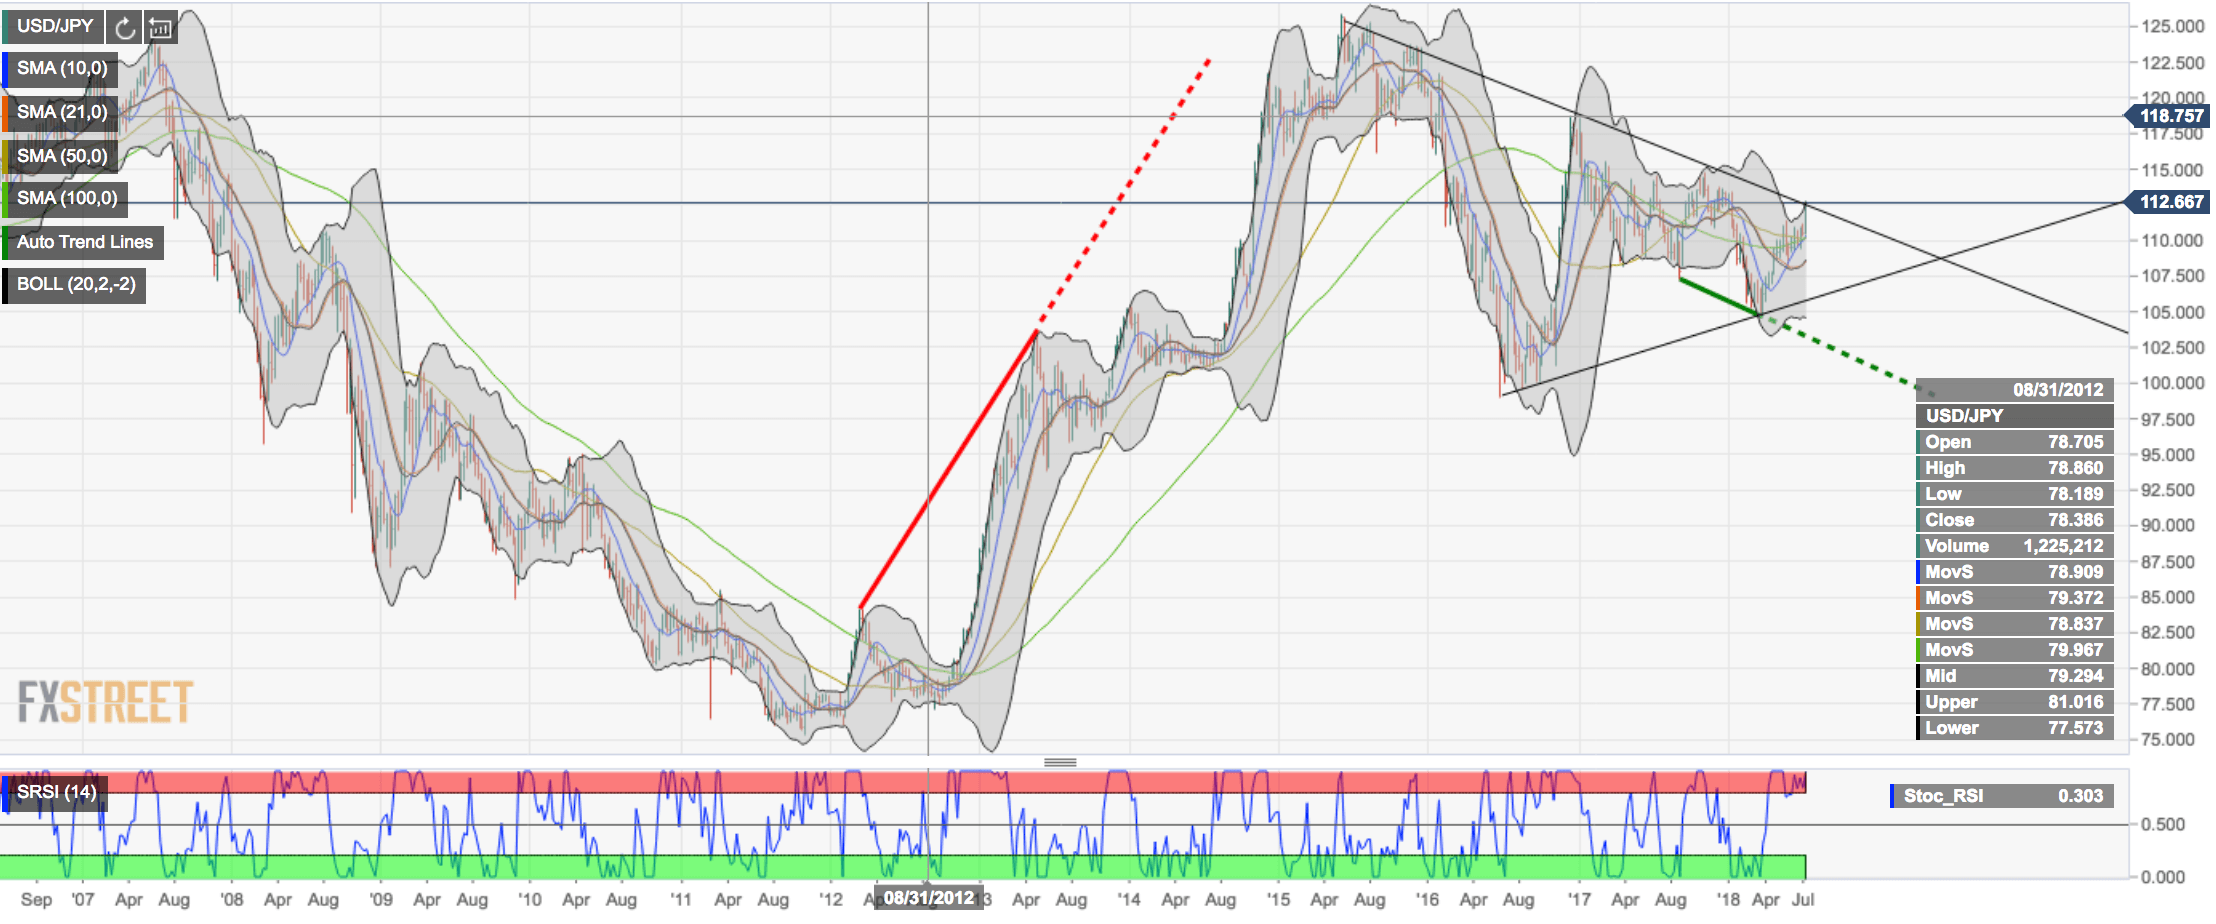
- The downtrend is being eroded on the weekly sticks.
- Targets the 113.27 the 200-week ma before the 114.73 November 2017 high.
Spot rate: 112.64
High: 112.70
Low: 112.51
Trend: Bullish daily, although 5-min chart RSI turning out of overbought territory, leaning bearish.
Resistance 1: 112.70
Resistance 2: 200-week moving average at 113.27
Resistance 3: major resistance at 114.00-25
Resistance 4: 114.735 November 2017 high.
Support 1: 112.50
Support 2: 111.90
Support 3: 111.39/58 recent high and the 2015-2018 downtrend,

