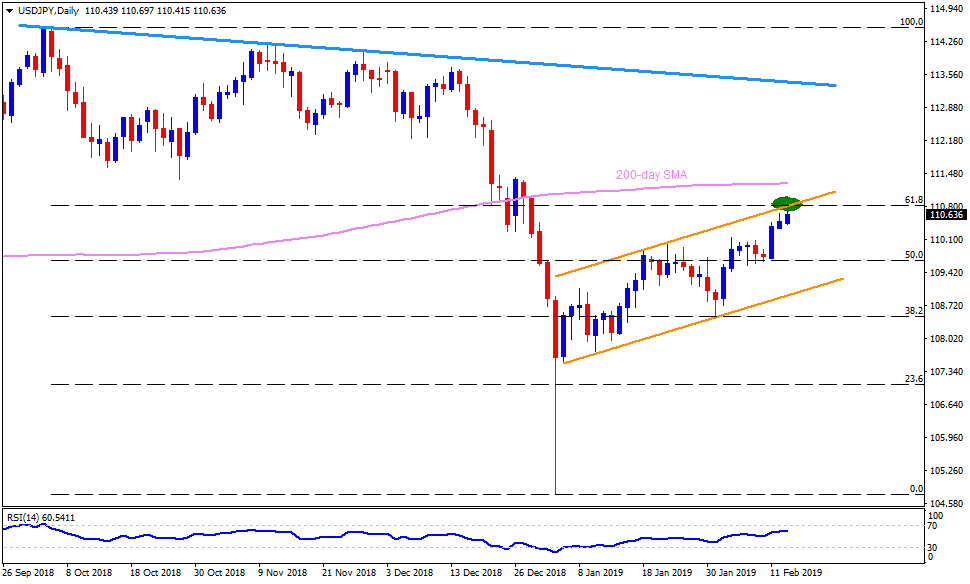
- USD/JPY trades around 110.65 ahead of European markets open on Wednesday.
- The pair remains well passed the two-week high and follows short-term ascending trend-channel.
- However, resistance line of the channel formation and 61.8% Fibonacci retracement of October to January decline, at 110.80, can challenge recent upside momentum.
- Hence, buyers need to conquer the 110.80 mark on a daily closing basis prior to confronting the 200-day SMA level of 111.30 and October month low near 111.40.
- Should there be a pullback, 110.30 and 110.00 could offer immediate support, a break of which drag the quote to 109.80 and 109.10.
- During the pair’s extended downturn under 109.10, support-line of the channel, at 108.90, may become sellers’ favorite as it holds the gate for the pair’s drop to 108.50 and 108.00 supports.
USD/JPY daily chart
Additional important levels:
Overview:
Today Last Price: 110.65
Today Daily change: 18 pips
Today Daily change %: 0.16%
Today Daily Open: 110.47
Trends:
Daily SMA20: 109.62
Daily SMA50: 110.3
Daily SMA100: 111.69
Daily SMA200: 111.28
Levels:
Previous Daily High: 110.66
Previous Daily Low: 110.34
Previous Weekly High: 110.16
Previous Weekly Low: 109.43
Previous Monthly High: 110
Previous Monthly Low: 104.75
Daily Fibonacci 38.2%: 110.54
Daily Fibonacci 61.8%: 110.46
Daily Pivot Point S1: 110.33
Daily Pivot Point S2: 110.18
Daily Pivot Point S3: 110.01
Daily Pivot Point R1: 110.64
Daily Pivot Point R2: 110.8
Daily Pivot Point R3: 110.95
