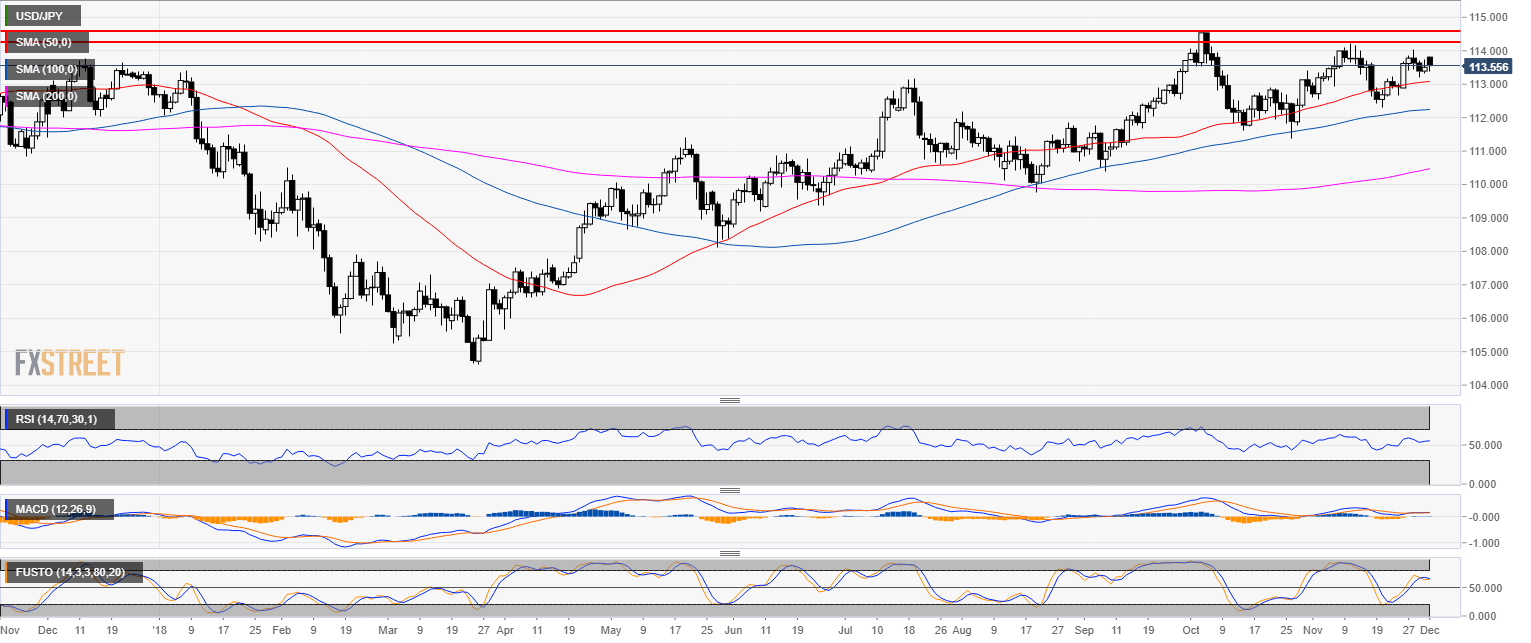
USD/JPY daily chart
- USD/JPY is trading in a bull trend below the 50, 100 and 200-day simple moving average (SMA).
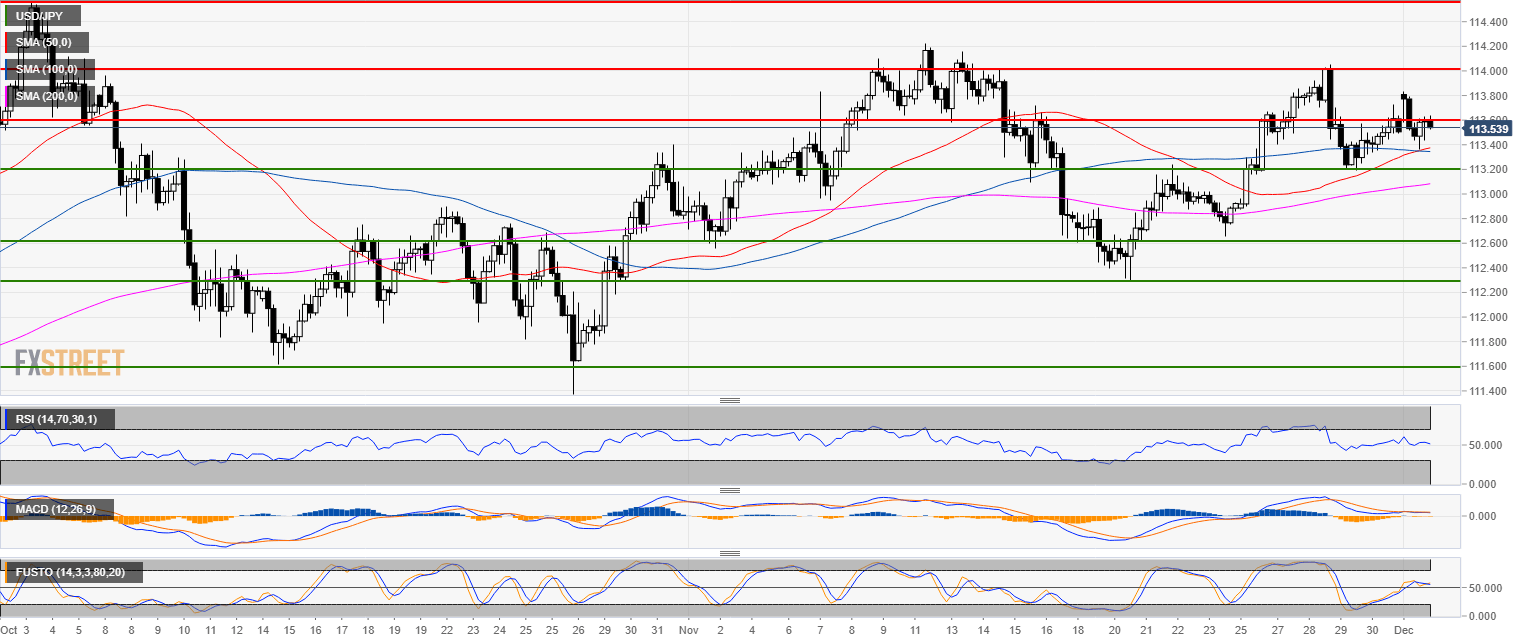
USD/JPY 4-hour chart
- USD/JPY is trading below its main SMAs.
- 113.60 remains the main hurdle for bulls to break to the upside.
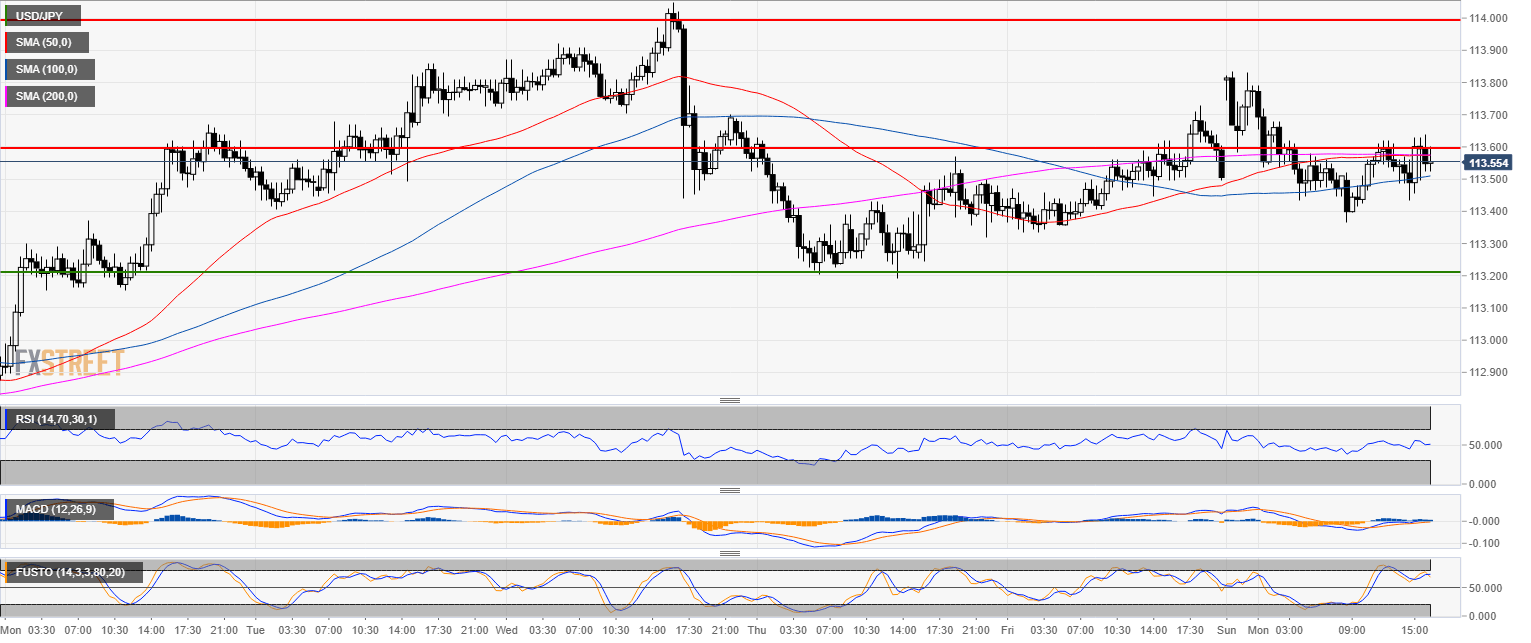
USD/JPY 30-minute chart
- If the 113.60 keep capping bullish advances a pullback to 113.20 can be on the cards.
Additional key levels
USD/JPY
Overview:
Today Last Price: 113.55
Today Daily change: 4.0 pips
Today Daily change %: 0.0352%
Today Daily Open: 113.51
Trends:
Previous Daily SMA20: 113.38
Previous Daily SMA50: 113.07
Previous Daily SMA100: 112.23
Previous Daily SMA200: 110.43
Levels:
Previous Daily High: 113.73
Previous Daily Low: 113.34
Previous Weekly High: 114.04
Previous Weekly Low: 112.88
Previous Monthly High: 114.25
Previous Monthly Low: 112.3
Previous Daily Fibonacci 38.2%: 113.58
Previous Daily Fibonacci 61.8%: 113.49
Previous Daily Pivot Point S1: 113.32
Previous Daily Pivot Point S2: 113.14
Previous Daily Pivot Point S3: 112.94
Previous Daily Pivot Point R1: 113.71
Previous Daily Pivot Point R2: 113.91
Previous Daily Pivot Point R3: 114.09
