- The Yen is demand on the back of fear of trade war between China and the United States.
- USD/JPY is testing an important support at 110.00 level, can bears break it?
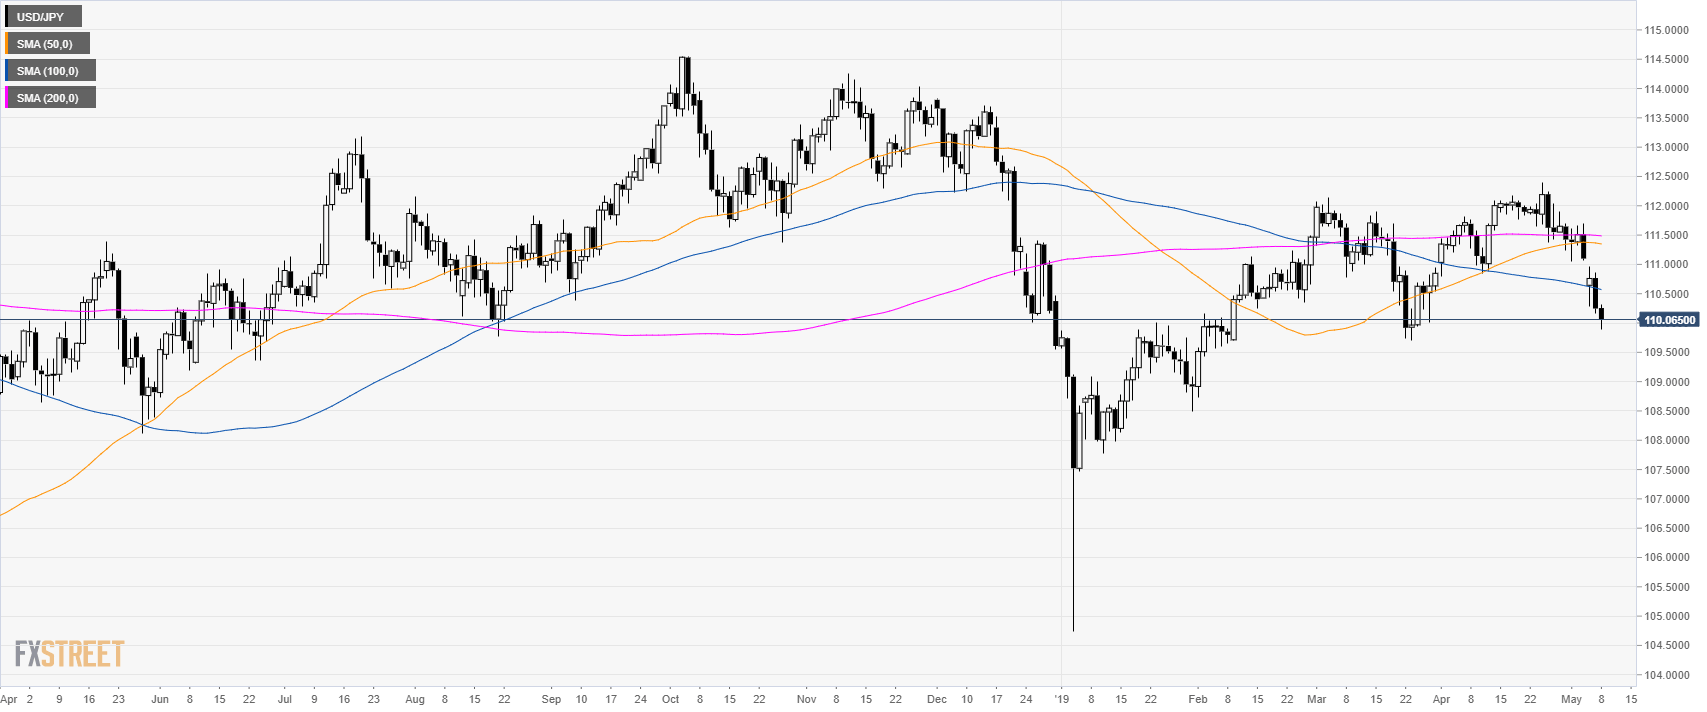
USD/JPY daily chart
USD/JPY is trading in a bear leg below its main simple moving averages (SMAs).
The Yen is demand on the back of fear of trade war between China and the United States.

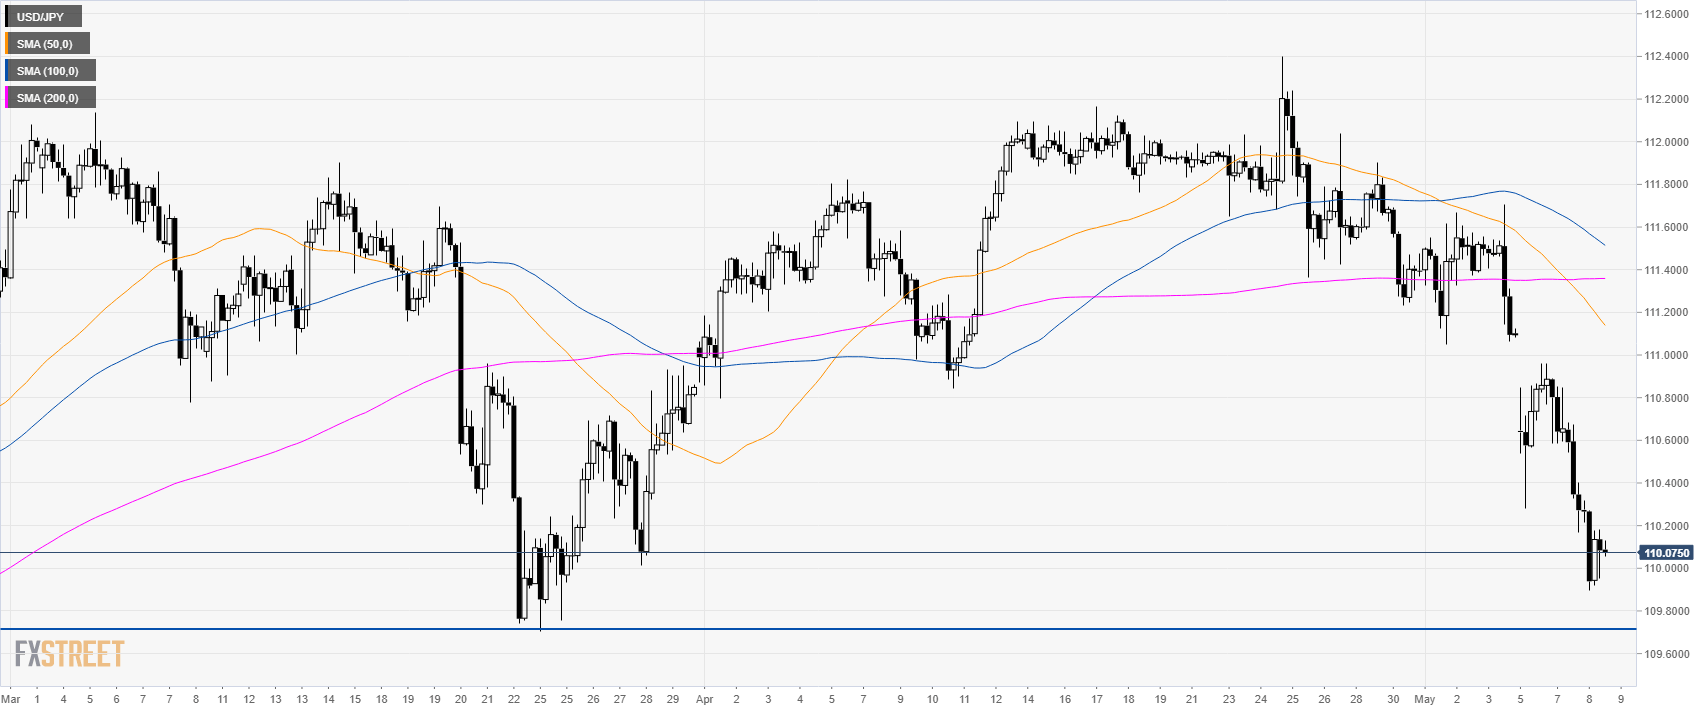
USD/JPY 4-hour chart
USD/JPY is trading steeply down near 110.00 figure and its main SMAs suggesting a bearish bias in the medium-term.
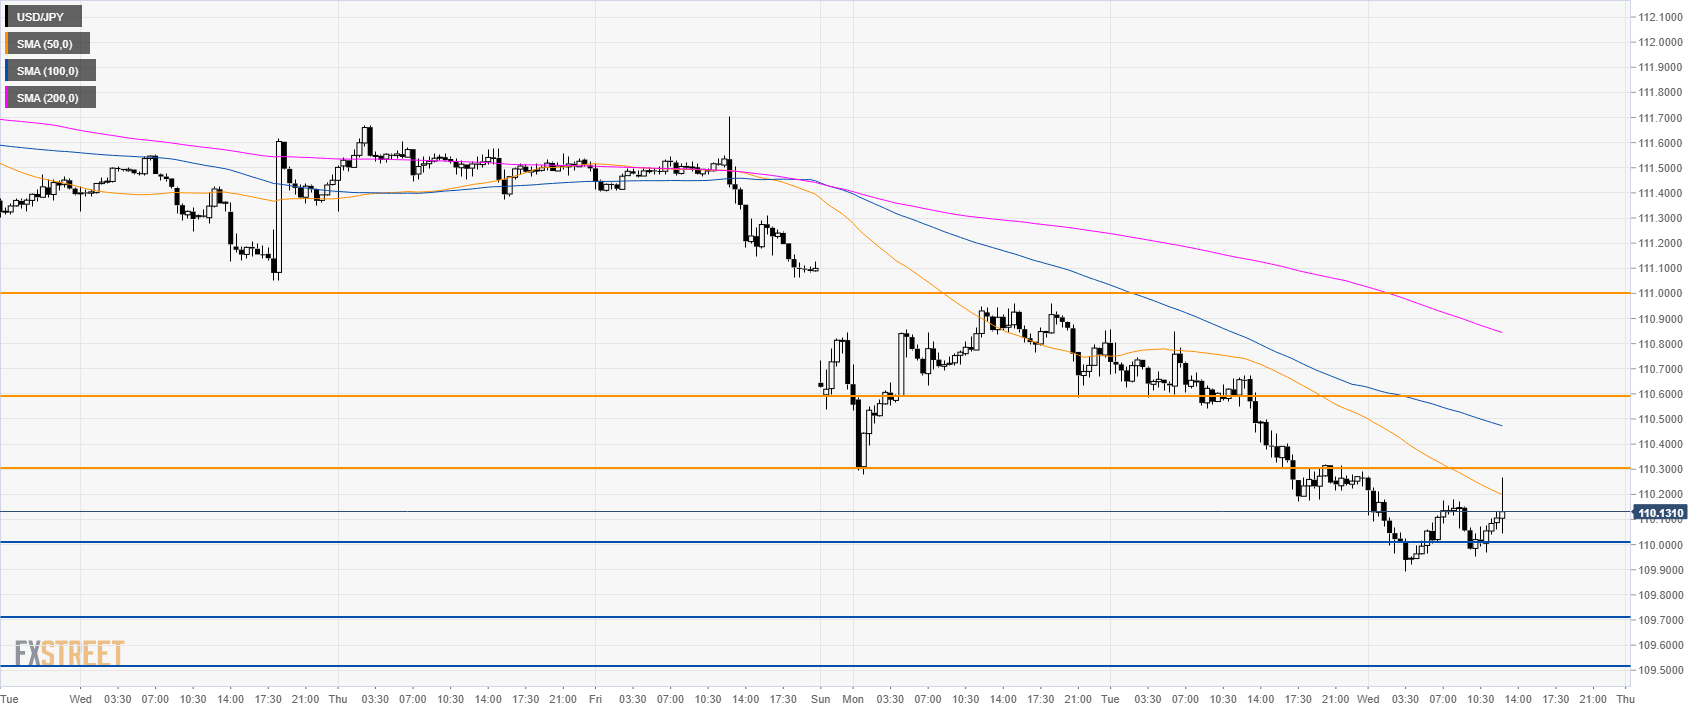
USD/JPY 30-minute chart
USD/JPY is drifting down below its main SMAs suggesting bearish momentum in the short-term.
Bears will need to overcome 110.00 psychological support in order to travel to 109.70 and 109.50 levels.
On the flip side, bulls will try to reclaim 110.30, 111.60 and 111.00 figure.
Additional key levels
